The individual income tax deduction for charitable giving provides a substantial incentive to give by reducing the taxpayer’s cost of donating. In 2023, charitable giving by individuals is estimated to reach $385 billion at an annual revenue loss of around $51 billion.
Charitable Giving by Itemizers and Nonitemizers
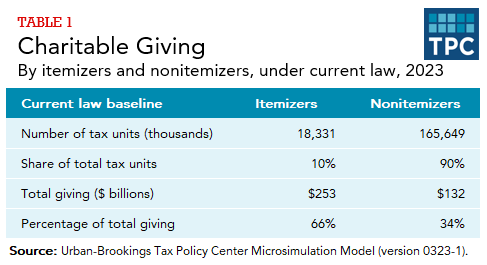
An income tax deduction for charitable giving is available only to taxpayers who itemize their deductions. Estimates from the Urban-Brookings Tax Policy Center (TPC) suggest that charitable giving by individuals could reach $385 billion in 2023. TPC estimates that the 90 percent of households that do not itemize their deductions will contribute about 35 percent of total charitable giving, while the 10 percent of households who itemize will provide about 65 percent (table 1).
Giving by Income Group
Charitable giving patterns differ by income. The charitable deduction provides higher-income taxpayers with a larger tax subsidy per dollar donated, because such taxpayers are more likely to itemize deductions and because they generally face higher marginal tax rates. Some research indicates that higher-income taxpayers are also more responsive or sensitive to each dollar of tax subsidy than others—that is, each dollar of government cost generates more charitable contributions by them—perhaps because a subsidy is more salient to those more likely to use tax advisers, or simply because they consume a smaller share of their income and therefore have a larger share of income out of which they can give.
Tax proposals that affect incentives for higher-income individuals to give, however, will have a disproportionate effect on the charities to which these individuals are more likely to donate, such as higher education and museums.
Table 2 shows the amount of charitable contributions for taxpayers claiming an itemized deduction for those contributions in tax year 2020. It does not include giving by nonitemizers. A few things to note: First, most low- and moderate-income taxpayers did not claim a deduction for charitable contributions, largely because most did not itemize. Second, at very high income levels, about 80 percent or more taxpayers claim charitable deductions. And third, the pattern of deductible charitable giving as a percentage of income by itemizers is U-shaped—average giving is high for the large percentage of high-income taxpayers who do itemize and for the small percentage of lower-income taxpayers who itemize; for the latter, this is likely because they become itemizers due to high rates of charitable giving, or mortgage interest, or other itemizable expenses as a share of their income. It is also possible that for some, their incomes are temporarily low while they maintain past charitable giving levels.

Average Tax Incentive for Giving
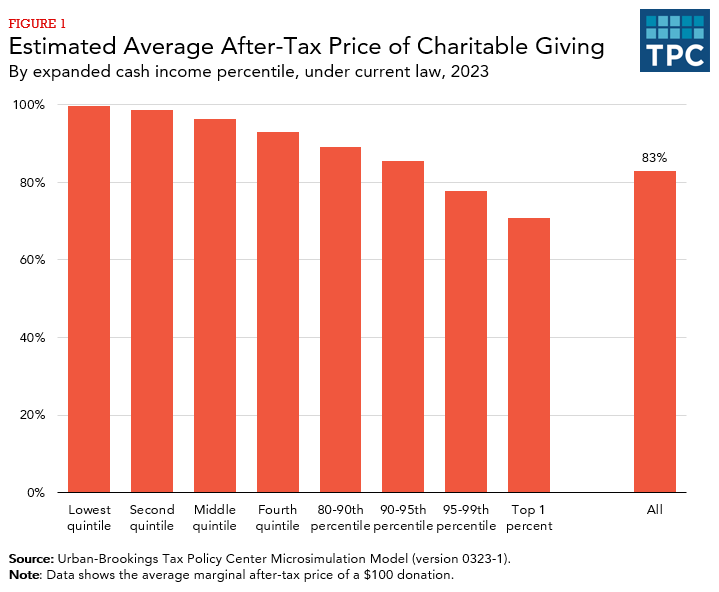
The after-tax cost of giving is the value of the gift minus any tax benefits received. If an itemizing taxpayer with a marginal tax rate of 24 percent (that is, the tax rate on the last dollars of income) gives $100 to a local college, for instance, the gift reduces the income tax bill for that person by $24, so the deductible charitable gift has a net cost of only $76. The $24 is the amount of the federal subsidy for giving. If the taxpayer had a 40 percent tax rate, the donation becomes even less costly to the taxpayer, at only $60. In other words, as marginal tax rates increase, the after-tax “price” of charitable giving decreases.
Figure 1 shows a summary of the average after-tax price of charitable giving for taxpayers at different income levels in 2023. For the entire population, it is about 83 percent; that is, on average the after-tax federal subsidy is 17 percent. This represents a drop of about 4 percentage points from the average federal subsidy rate of around 21 percent before the passage of the 2017 Tax Cuts and Jobs Act. Note that taxpayers in the top 1 percent have the lowest after-tax price of charitable giving both because they face higher tax rates and because they are more likely to itemize.
Estimated Revenue Loss from the Charitable Deduction
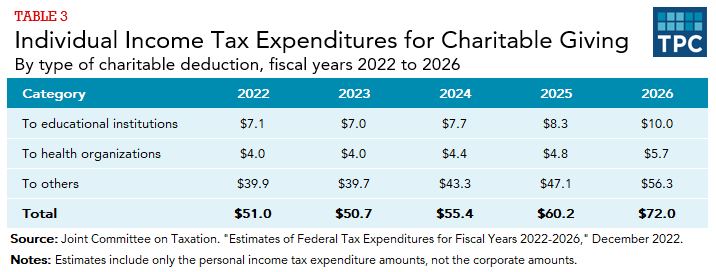
The individual charitable deduction is estimated to cost approximately $51 billion in 2023 and $289 billion over five years (2022–26) (table 3). The relationship between the revenue loss and the amount of additional giving created by the tax incentive has significant policy implications. For example, if the loss in federal revenue from allowing the charitable deduction is greater than the increase in charitable giving caused by the deduction, then a portion of the federal subsidy is going to donors rather than to the ultimate beneficiaries of charitable gifts. To the extent that Congress views charitable and government efforts as direct substitutes, it might find it more efficient to eliminate the deduction and provide charities with direct federal support.
This sometimes leads to proposals, such as allowing a deduction only for giving that exceeds a dollar floor, to concentrate a greater share of the tax incentive on the last rather than first dollars of giving by any taxpayer getting the incentive. Research suggests that first dollars of giving are much less responsive to tax incentives. Studies on the impact of the tax incentive, however, do not deal with and therefore may underestimate the extent to which the presence of a tax incentive helps create a culture of giving.
Limits on the Charitable Deduction
Congress has placed many limits on the availability of a charitable deduction. Among them are the following:
The charitable deduction is only available for a subset of qualifying tax-exempt organizations that are charitable in nature, as defined in section 501(c)(3) of the tax code. Contributions to many tax-exempt organizations, such as unions and chambers of commerce, are not deductible, though income earned on assets within those organizations is generally excluded from taxation.
Contributions for individuals are generally allowed up to 60 percent of adjusted gross income, but there is a 30 percent limit for contributions to a foundation and certain other organizations and a 30 percent limit for contributions of capital gain property. Deductible contributions for corporations are limited to 10 percent of corporate income.
Updated January 2024
Boris, Elizabeth T., and C. Eugene Steuerle, eds. 2016. Nonprofits and Government: Collaboration and Conflict, 3rd ed. Lanham, MD: Rowman & Littlefield.
McClelland, Robert, C. Eugene Steuerle, Chenxi Lu, and Aravind Boddupalli. 2019. “Tax Incentives for Charitable Contributions.” Washington, DC: Tax Policy Center.
McKeever, Brice S., Nathan E. Dietz, and Saunji D. Fyffe. 2016. The Nonprofit Almanac, 9th ed. Lanham, MD: Rowman & Littlefield.
Stallworth, Philip, Chenxi Lu, and C. Eugene Steuerle. 2016. “Both Clinton and Trump Would Reduce Tax Incentives for Charitable Giving.” TaxVox (blog). Washington, DC: Urban-Brookings Tax Policy Center.