Over 92 percent of individuals had health insurance at some point during the year in 2024, with higher coverage rates for those with higher incomes.
In 2024, about 49 percent of the US population obtained health insurance coverage through employment (figure 1). Another 6.1 percent purchased coverage on their own in the private (nongroup) market, including the Affordable Care Act marketplace, while 17.6 percent were covered by Medicaid and 17.2 percent were covered by Medicare. Other public sources accounted for 2.3 percent of coverage. About 8 percent were uninsured for the year.
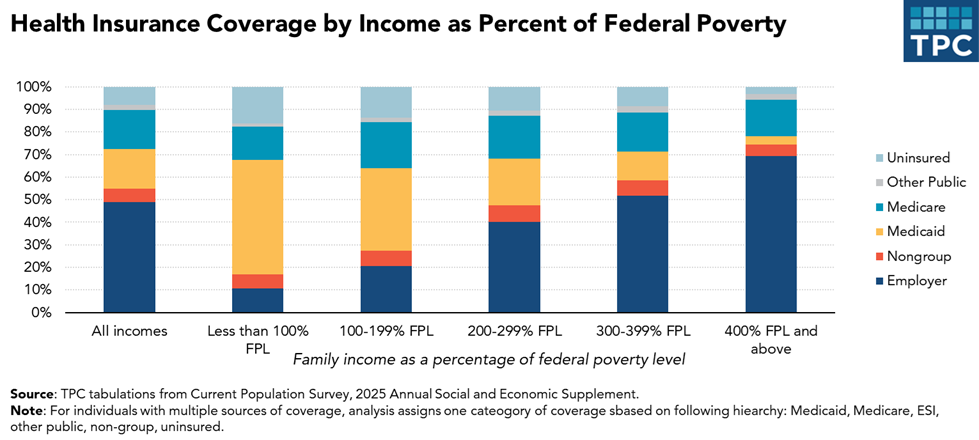
Among individuals with family incomes below 100 percent of the federal poverty level, 10.6 percent obtained health insurance through employment, while just over 6 percent purchased private coverage. About 16 percent reported having no health insurance, public or private. In contrast, 69 percent of those with incomes above 400 percent of the federal poverty level had coverage through their employer, 5 percent purchased private coverage, and just 3 percent had no insurance.
Health insurance coverage is projected to decline in the coming years due to policies enacted by the One Big Beautiful Bill Act (OBBBA). The OBBBA included many changes to Medicaid and the premium tax credit that are expected to reduce coverage. Policy changes include stricter verification of eligibility for both programs, work requirements for Medicaid recipients, and denying premium tax credit eligibility for certain lawfully present immigrants. The Congressional Budget Office projects these and other OBBBA policies will reduce health insurance coverage by 10 million people by 2034.
Updated October 2025
Burns, Alice, et al. 2025.How Will the 2025 Reconciliation Law Affect the Uninsured Rate in Each State? Kaiser Family Foundation.
Census Bureau. 2025. Health Insurance Coverage in the United States: 2024.