Tax and expenditure limits (TELs) restrict the growth of government revenues or spending by either capping them at fixed-dollar amounts or limiting their growth rate to match increases in population, inflation, personal income, or some combination of those factors. As of 2020, 31 states had at least one kind of TEL, including those states requiring a supermajority vote of the legislature to raise new taxes or revenues.
Background
Most TELs emerged during the “tax revolt” of the late 1970s or the economic recession of the early 1990s. Although many of the best-known local property tax limits, such as California’s Proposition 13 and Massachusetts’s Proposition 2½, were adopted through citizen initiatives, most state TELs originated in their legislatures and limited expenditures, not revenue. As of 2021, only nine states had enacted TELs through voter initiatives. Michael New (2010) found that TELs adopted through citizen referendum were more effective than those adopted by legislatures.
How States Design Tax and Expenditure Limits
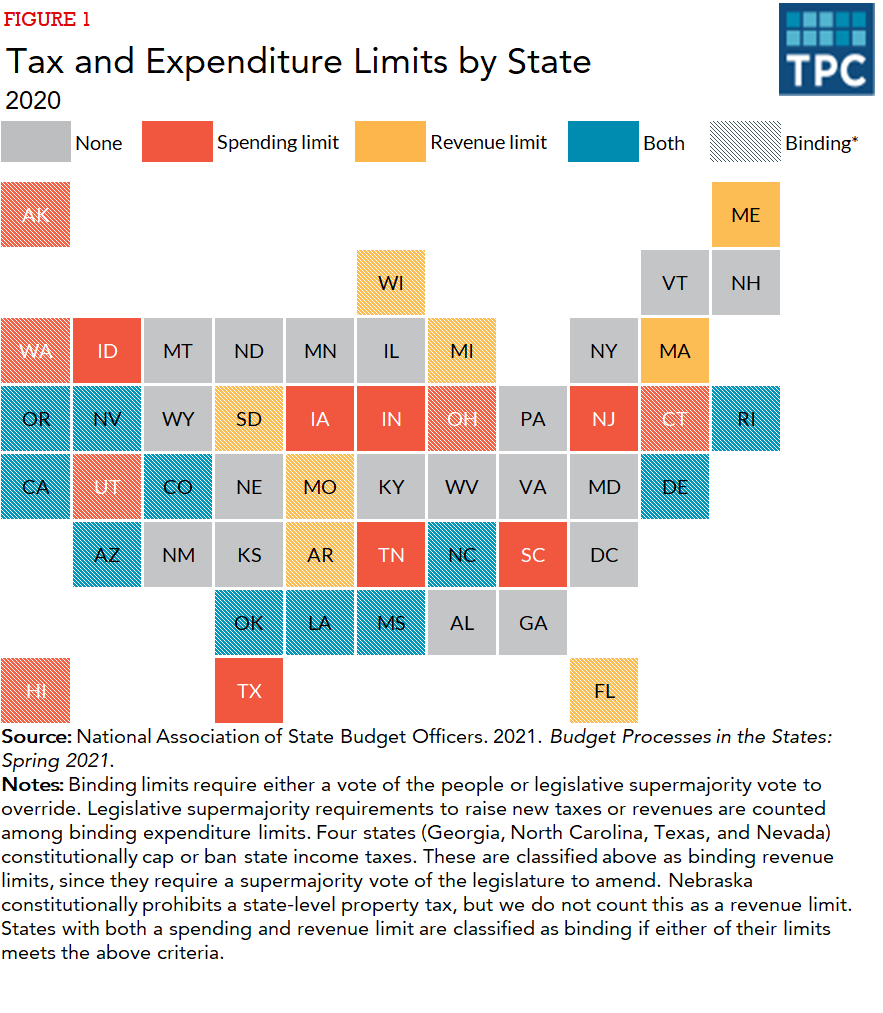
Spending versus revenue limits: States can limit their own revenues, appropriations, or both. (Some states also limit local taxes, for example, restricting the growth of a local government’s property tax revenue.) In 2020, 24 states imposed limits on state spending (figure 1), 19 states limited state revenue, and 12 states limited both. Among states with revenue limits, 14 required a legislative supermajority (usually three-fifths or two-thirds of the legislature) to raise taxes or revenue, eight limited revenue via other mechanisms, and three did both.
Mechanism: The limit on spending or revenue can be either a cap on growth or a restriction on the level. The most common formula restricts the expenditure growth rate to the growth rate of personal income, but some states include population and inflation growth in the formula. Other states restrict expenditures to a specific level, also often determined by a formula, such as a set percentage of personal income. Idaho, for example, limits expenditures to 5.33 percent of state personal income, thereby allowing expenditures to grow at the same rate as the economy. Another method is to restrict expenditures to a percentage of projected revenue, maintaining a cushion in case revenues fall short of projections.
Stringency: In general, constitutional provisions are more difficult to change or override than statutory TELs. By the same token, TELs imposed directly by voters rather than by legislators are more restrictive (New 2010). The most stringent revenue limits require that surplus revenue go back to taxpayers as rebates or be sequestered in rainy day funds. Oregon’s “Kicker” rebate and Colorado’s Taxpayer Bill of Rights are examples.
In some states with TELs, the legislature can override the cap with a simple majority. As such, many TELs that look restrictive on paper are easily overridden. But other states created large obstacles to overriding TELs: 13 states require either a legislative supermajority or a popular vote to override their spending limits, and four impose this requirement on their revenue limits. Additionally, 14 states stringently bind revenues by requiring a legislative supermajority to raise new taxes or revenues.
Property Tax Limits
Property tax limits constitute a special category of revenue limit because, in most cases, they are set by state governments but apply to local governments. Only two states—New Hampshire and Vermont—do not limit property taxes. State restrictions can apply to the property, to the jurisdiction, or both. Rate limits impose maximum rates on jurisdictions (e.g., counties, municipalities, and school districts). Limits on the growth of property tax assessments are typically applied to properties.
For example, Arizona limits residential property assessment to 10 percent of a home’s value, growth in its property tax base to 5 percent annually, combined state and local tax rates for owner-occupied residences to a maximum of 1 percent of the state’s limited property value, and growth in local property tax levies to 2 percent annually plus new construction. The state also caps expenditures for most local governments.
How Limits Affect Spending
Evidence on whether TELs limit state and local spending is mixed (Gordon 2008). Rueben (1996) found that the laws’ details matter and that TELs requiring a legislative supermajority or popular vote to modify spending reduced state general fund expenditures by 2 percent. However, those state savings were partly offset by higher local spending.
Knight (2000) found that states with both a supermajority requirement to raise taxes (a kind of revenue limit) and an additional tax or expenditure limit had lower expenditures than states with just one constraint. Poterba and Rueben (1999) found that TELs affect the costs of state borrowing in two ways: not surprisingly, spending limits lower the costs and revenue limits increase them.
The strictest tax limitations, like the original implementation of the TABOR rule in Colorado, can also prevent states from saving revenues in rainy day funds to cushion against downturns. Randall and Rueben (2017) concluded that states should specifically reform TELs that prevent them from saving during good times. Rueben, Randall and Boddupalli (2018) found that, during the Great Recession, states with binding revenue limits or a combination of binding revenue and expenditure limits were more responsive to deficit shocks than states with weaker rules.
Updated January 2024
Brooks, Leah, Yosh Halberstam, and Justin Phillips. 2014. “Spending within Limits: Evidence from Municipal Fiscal Restraints.” Working paper. Toronto: University of Toronto.
Gordon, Tracy. 2008. “The Calculus of Constraint: A Critical Review of State Fiscal Institutions.” In Fiscal Challenges: An Interdisciplinary Approach to Budget Policy, edited by Elizabeth Garrett, Elizabeth Graddy, and Howell E. Jackson, 271–87. New York: Cambridge University Press.
Haveman, Mark, and Terry A. Sexton. 2008. “Property Tax Assessment Limits: Lessons from Thirty Years of Experience.” Cambridge, MA: Lincoln Institute of Land Policy.
Knight, Brian J. 2000. “Supermajority Voting Requirements for Tax Increases: Evidence from the States.” Journal of Public Economics 76 (1): 41–67.
McGuire, Therese J., and Kim S. Rueben. 2006. “The Colorado Revenue Limit: The Economic Effects of TABOR.” Washington, DC: Economic Policy Institute.
Mullins, Daniel R., and Bruce A. Wallin. 2004. “Tax and Expenditure Limitations: Introduction and Overview.” Public Budgeting and Finance 24 (4): 2–15.
New, Michael. 2010. “US State Tax Expenditure Limitations: A Comparative Political Analysis.” State Politics and Policy Quarterly 10 (1): 25–50.
Poterba, James M., and Kim S. Rueben. 1999. “Fiscal Rules and State Borrowing Costs: Evidence from California and Other States.” San Francisco: Public Policy Institute of California.
Randall, Megan, and Kim Rueben. 2017. “Sustainable Budgeting in the States.” Washington, DC: Urban Institute.
Rueben, Kim S. 1996. “Tax Limitations and Government Growth: The Effect of State Tax and Expenditure Limits on State and Local Government.” San Francisco, CA: Public Policy Institute of California.
Rueben, Kim, Megan Randall, and Aravind Boddupalli. 2018. “Budget Processes and the Great Recession: How Fiscal Institutions Shape Tax and Spending Decisions.” Washington, DC: Urban Institute.
Urban-Brookings Tax Policy Center. 2018. “Building State Budgets: Effective Process and Practice.” Washington, DC.
Watkins, Kate. 2009. “State Spending Limitations: TABOR and Referendum C.” Memorandum, July 6. Denver: Colorado Legislative Council.