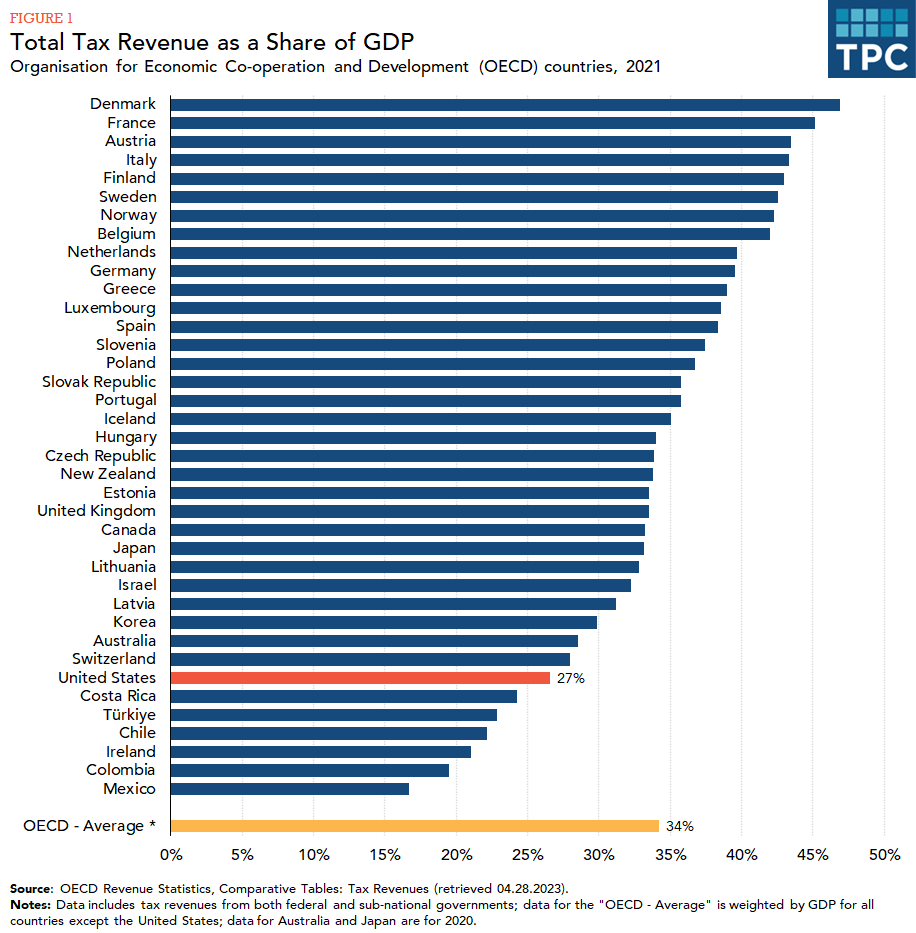
Total US tax revenue equaled 27 percent of gross domestic product, well below the 34 percent weighted average for the other 37 OECD countries.
TOTAL TAX REVENUE
US taxes are low relative to those in other high-income countries (figure 1). In 2021, taxes at all levels of US government represented 27 percent of gross domestic product (GDP), compared with a weighted average of 34 percent for the other 37 member countries of the Organisation for Economic Co-operation and Development (OECD).
Six OECD countries (Chile, Colombia, Costa Rica, Ireland, Mexico, and Türkiye) collected less tax revenue than the United States as a percentage of GDP. Taxes exceeded 40 percent of GDP in eight European countries, including Denmark, where taxes were 47 percent of GDP. Those countries generally provide more extensive government services than the United States does.
COMPOSITION OF TAX REVENUE
Income and Profits Taxes: Taxes on personal income and business profits made up 48 percent of total US tax revenue in 2021, a higher share than in most other OECD countries, where such taxes averaged 34 percent of the total (figure 2). Australia, Denmark, and New Zealand were the only OECD countries where over half of total revenue was generated from such taxes.
In the United States, taxes on just the income and profits of individuals (not businesses) generated 42 percent of total tax revenue, compared with 27 percent for all other OECD countries combined.
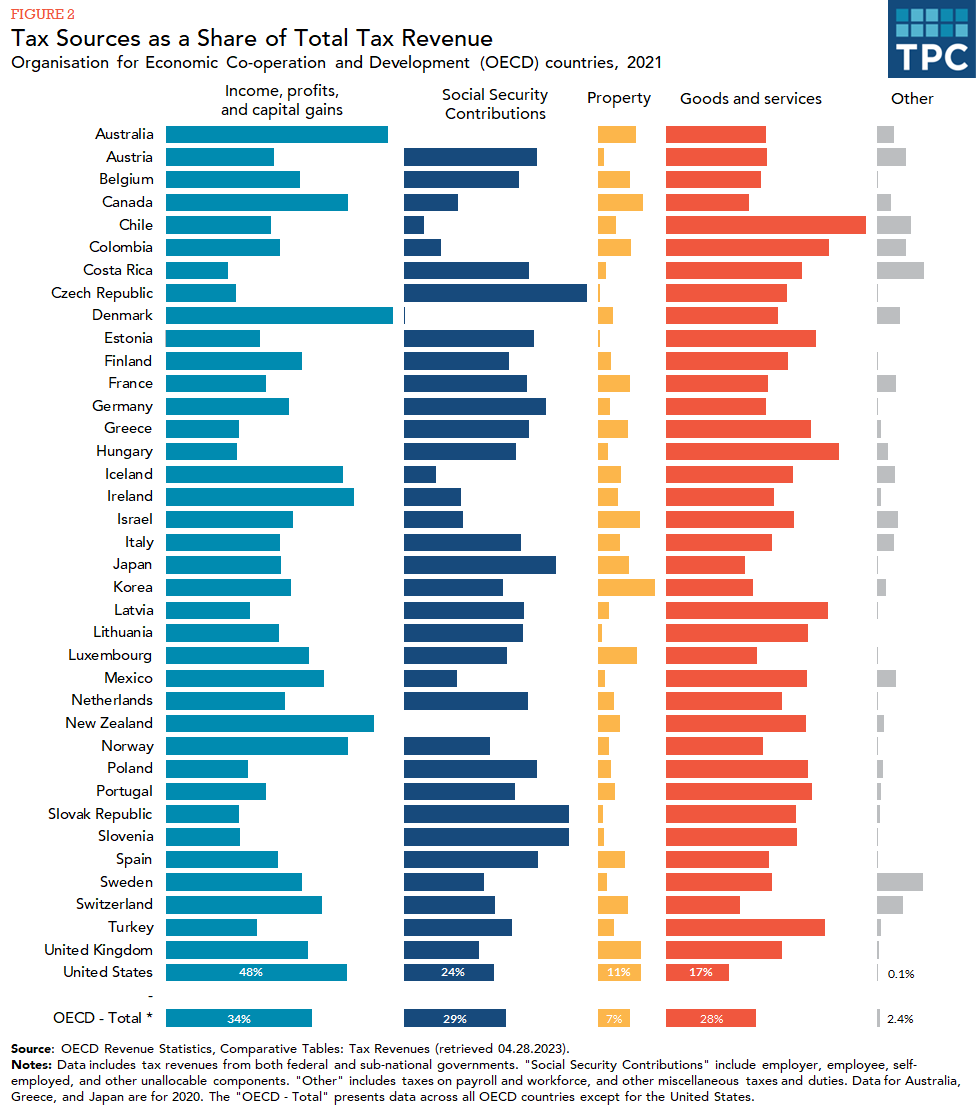
Social Security Contributions: The United States collected less revenue from retirement, disability, and other social security programs—24 percent of total tax revenue—than the 29 percent average across the 37 other OECD countries. Some countries were well above that average: the Czech Republic, Japan, Slovak Republic, and Slovenia each collected over 40 percent of their revenue from Social Security contributions.
Property Taxes: Taxes on property, estates, and gifts provided 11 percent of US tax revenue, compared with 7 percent for all other OECD countries. Almost all revenue from taxes on property in the US is collected by state and local governments.
Goods and Services Taxes: The United States relies less on taxes on goods and services (including both general consumption taxes and selective sales taxes on specific goods and services) than any other OECD country, collecting 17 percent of tax revenue this way compared with 28 percent for the rest of the OECD. Chile collected the highest share of its total tax revenue from taxes on goods and services (53 percent).
The value-added tax (VAT)—a type of general consumption tax collected in stages—is the main source of consumption tax revenue within the OECD. The VAT is employed worldwide in 160 countries, including in all 37 OECD member countries except the United States. Most consumption tax revenue in the United States is collected by state and local governments.
Updated January 2024
Congressional Budget Office. 2017. "International Comparisons of Corporate Income Tax Rates.” Washington, DC: Congressional Budget Office.
Gleckman, Howard, and Aravind Boddupalli. 2019. "No, The US Is Not Overtaxed.” TaxVox. Washington, DC: Urban-Brookings Tax Policy Center.