Payroll taxes are levied to finance Social Security, the hospital insurance portion (Part A) of Medicare, and the federal unemployment insurance program. Revenue in 2022 totaled just over $1.2 trillion.
Social Security
Social Security, or more formally, Old-Age, Survivors, and Disability Insurance (OASDI), provides benefits to elderly and disabled workers, their spouses, and surviving spouses or dependents. It is one of the largest items in the federal budget, with benefits payments of $1.23 trillion in 2022 (SSA 2023).
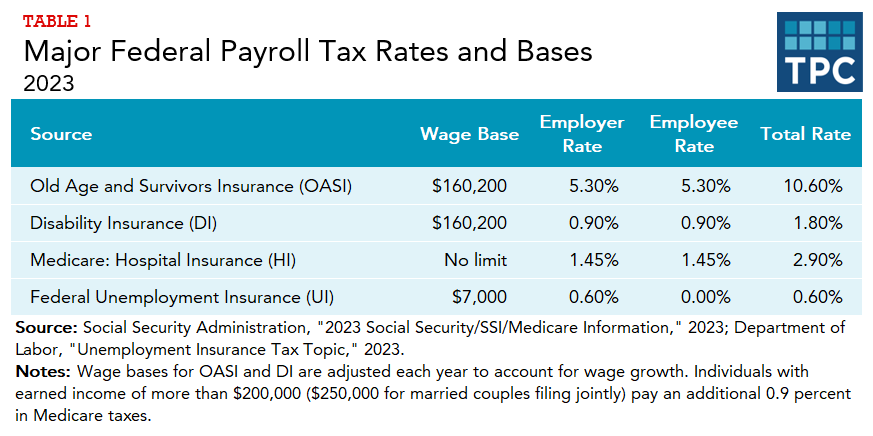
Benefits are mainly financed by a payroll tax on cash wages, up to an annual maximum indexed to average wage growth (table 1). For 2023, maximum taxable earnings are $160,200. Employers and employees each contribute 6.2 percent of the workers’ wages for a combined 12.4 percent—10.6 percent for the OASI trust fund (retirement and survivors) and 1.8 percent for the DI trust fund (disability). Most economists believe that the employer portion of the tax, just like the employee portion, is borne by employees in the form of lower net compensation.
Occasionally, monies have been reallocated between the OASI and DI trust funds. The Bipartisan Budget Act of 2015 temporarily reallocated a portion of the OASI tax to the DI trust fund for 2016 to 2018 to shore up the DI trust fund, which faced insolvency. For those years, the combined employer and employee rates were 10.03 percent for OASI and 2.37 percent for DI. Projections for 2023 indicate that the DI trust fund is in better shape than the OASI fund, so that future reallocations could go the other way.
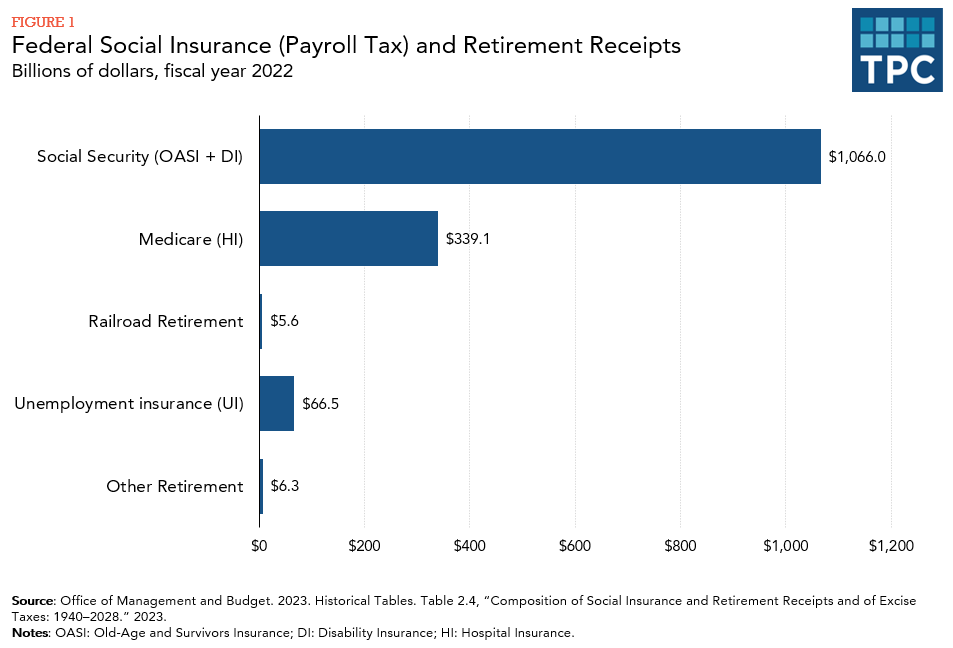
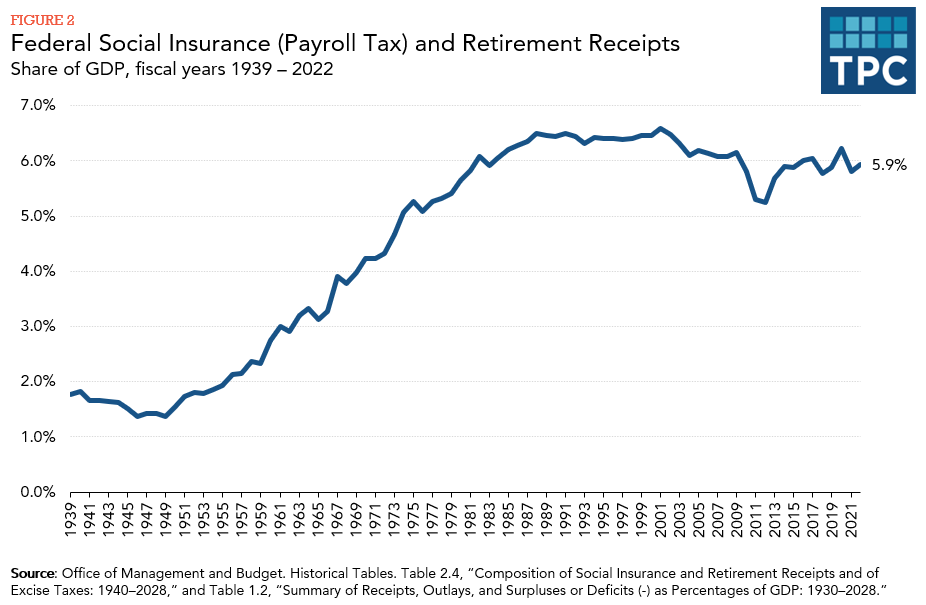
Over time, Social Security taxes have become a major share of federal revenues. When the tax was first collected in 1937, the combined payroll tax rate was 2.0 percent; it raised $580 million (or under $15 billion in 2023 dollars). In 2022, OASDI taxes totaled over $1.0 trillion and represented 23 percent of total federal receipts (figure 1).
Hospital Insurance
The hospital insurance (HI) program, or Part A of Medicare, covers inpatient hospital visits and other health care services for the elderly and some others suffering from specified maladies. Federal costs for other parts of Medicare, such as Part B, which covers doctors’ and other providers’ fees, are not covered by payroll taxes but mainly by general revenues and premiums paid by beneficiaries.
The HI program is financed mainly through payroll taxes on workers. Employers and employees each contribute 1.45 percent of the worker’s wages toward the HI trust fund for a combined rate of 2.9 percent (table 1). The cap on wages subject to the HI tax was removed in 1994. Also, beginning in 2013, single households earning more than $200,000 and married households earning more than $250,000 contributed an additional 0.9 percent of earnings over those thresholds (there is no employer portion for this “surtax”).
In 1966, the first year of HI tax collections, the combined tax rate was 0.7 percent, and collections totaled $1.9 billion (or under $20 billion in 2022 dollars). In 2022, federal HI tax revenues totaled $339 billion.
Unemployment Insurance
Unemployment insurance (UI) provides insured workers with benefits if they are involuntarily unemployed and meet eligibility requirements. UI programs are run by the states in partnership with the federal government. To finance benefits and program expenses, both the states and the federal government deposit payroll taxes into a federal trust fund.
The federal payroll tax rate is 6.0 percent on the first $7,000 of covered wages, but tax credits reduce the effective federal tax rate to 0.6 percent (table 1). State unemployment tax rates and wage bases vary but are usually below 4.0 percent and are on low wage bases.
In 2022, federal UI tax revenues totaled $67 billion.
Other Retirement Programs
Payroll taxes fund a handful of other retirement programs. The Social Security Administration operates one of the largest of these, a retirement program for the railroad industry that functions similarly to Social Security. Retirement programs for federal employees absorb most of the rest of payroll tax receipts.
Updated January 2024
Centers for Medicare and Medicaid Services. 2019. 2019 Medicare Trustees Report. Baltimore, MD.
Congressional Budget Office. 2018. The Budget and Economic Outlook: 2018 to 2028. Washington, DC.
Harris, Edward W. 2005. “Payroll Tax, Federal.” In The Encyclopedia of Taxation and Tax Policy, 2nd ed., edited by Joseph J. Cordes, Robert D. Ebel, and Jane G. Gravelle, 293–95. Washington, DC: Urban Institute Press.
Joint Committee on Taxation. 2018. “Overview of the Federal Tax System as in Effect for 2018.” JCX-3-18. Washington, DC.
Social Security Administration. 2019. “Summary: Actuarial Status of the Social Security Trust Funds.” Washington, DC.