  • Experts
  • Events
  • Briefing Book
  • Resources
  • About
  • Contact
  • Support
  • Fiscal Facts
Twitter
Facebook
Logo Site
  • Topics
    • Individual Taxes
    • Business Taxes
    • Federal Budget and Economy
    • State and Local Issues
    • Campaigns, Proposals, and Reforms
  • TaxVox Blog
  • Research & Commentary
  • Laws & Proposals
  • Model Estimates
  • Statistics
  • Features
Tax Policy Center

Statistics

Browse Statistics

  • Estate and Gift
  • High-Income
  • Payroll
  • Personal Wealth
  • Statistics
  • Overview
    • Tax Burden
    • Composition of Taxes
    • Federal Receipts & Outlays
  • Individual
    • AMT
    • Brackets
    • Credits
    • Current Statistics
    • Deductions & Exemptions
    • Sources of Income
    • Historical Data
  • Low-Income
    • EITC
    • Poverty
  • Corporate
  • Excise
  • State
    • Federal Tax Components and Credits by State
    • Main Features of State Tax Systems
    • State Revenues and Expenditures
  • International
  • Administration and Compliance

You are here

  1. Home
  2. Statistics
  3. Personal Wealth

Percentage of Families Holding Nonfinancial Assets

1989 to 2019

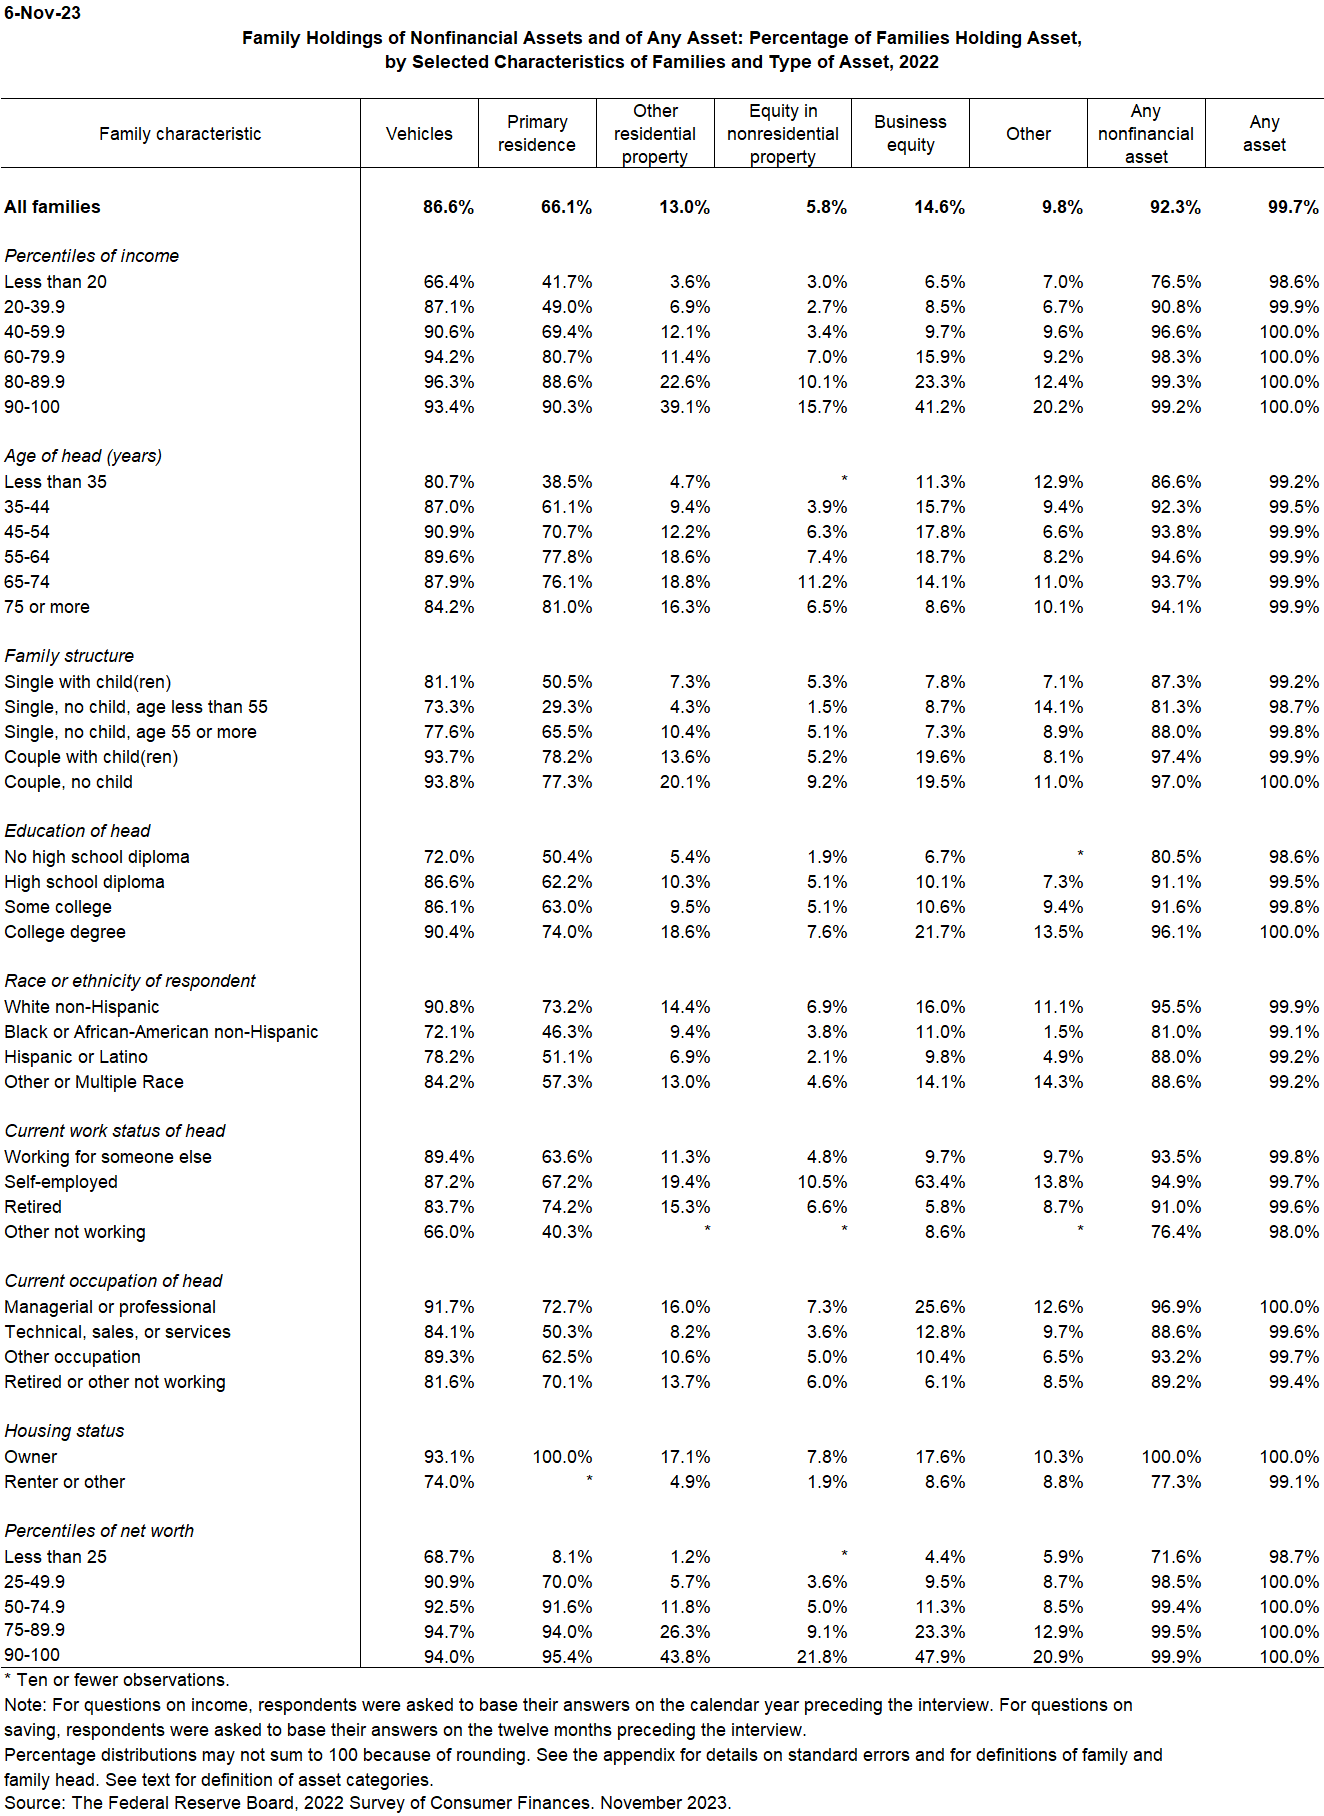
Percentage of families holding nonfinancial assets, by selected characteristics of families and type of asset, for survey years.

application/pdf Download wealth_nonfin_assets_pct.pdf (41.7 KB)
application/vnd.openxmlformats-officedocument.spreadsheetml.sheet Download wealth_nonfin_assets_pct.xlsx (414.02 KB)
October 9, 2020
Percentage of Families Holding Nonfinancial Assets
Individual Taxes
  • Donate Today
  • Topics
  • TaxVox Blog
  • Research & Commentary
  • Laws & Proposals
  • Model Estimates
  • Statistics
  • Privacy Policy
  • Newsletters
Twitter
Facebook
  • © Urban Institute, Brookings Institution, and individual authors, 2022.