The voices of Tax Policy Center's researchers and staff

This post is part of the Tax Policy Center’s new series, Tax Line, which digs into the data behind the day’s most pressing tax policy issues. You can read all posts in this monthly series by clicking on the topics tag, TaxLine, at the bottom of this post.
Individual tax expenditures reduced federal revenues by $1.168 trillion in 2015, according to new estimates by the Tax Policy Center. And the biggest share of these subsidies goes to the highest-income households.
These tax preferences range from widely used and popular subsidies such as the mortgage interest deduction and the exclusion for employer-sponsored health insurance to narrowly targeted provisions like the tax credit for solar-powered home appliances. Businesses receive their own tax code subsidies but they were not included in the recent TPC analysis.
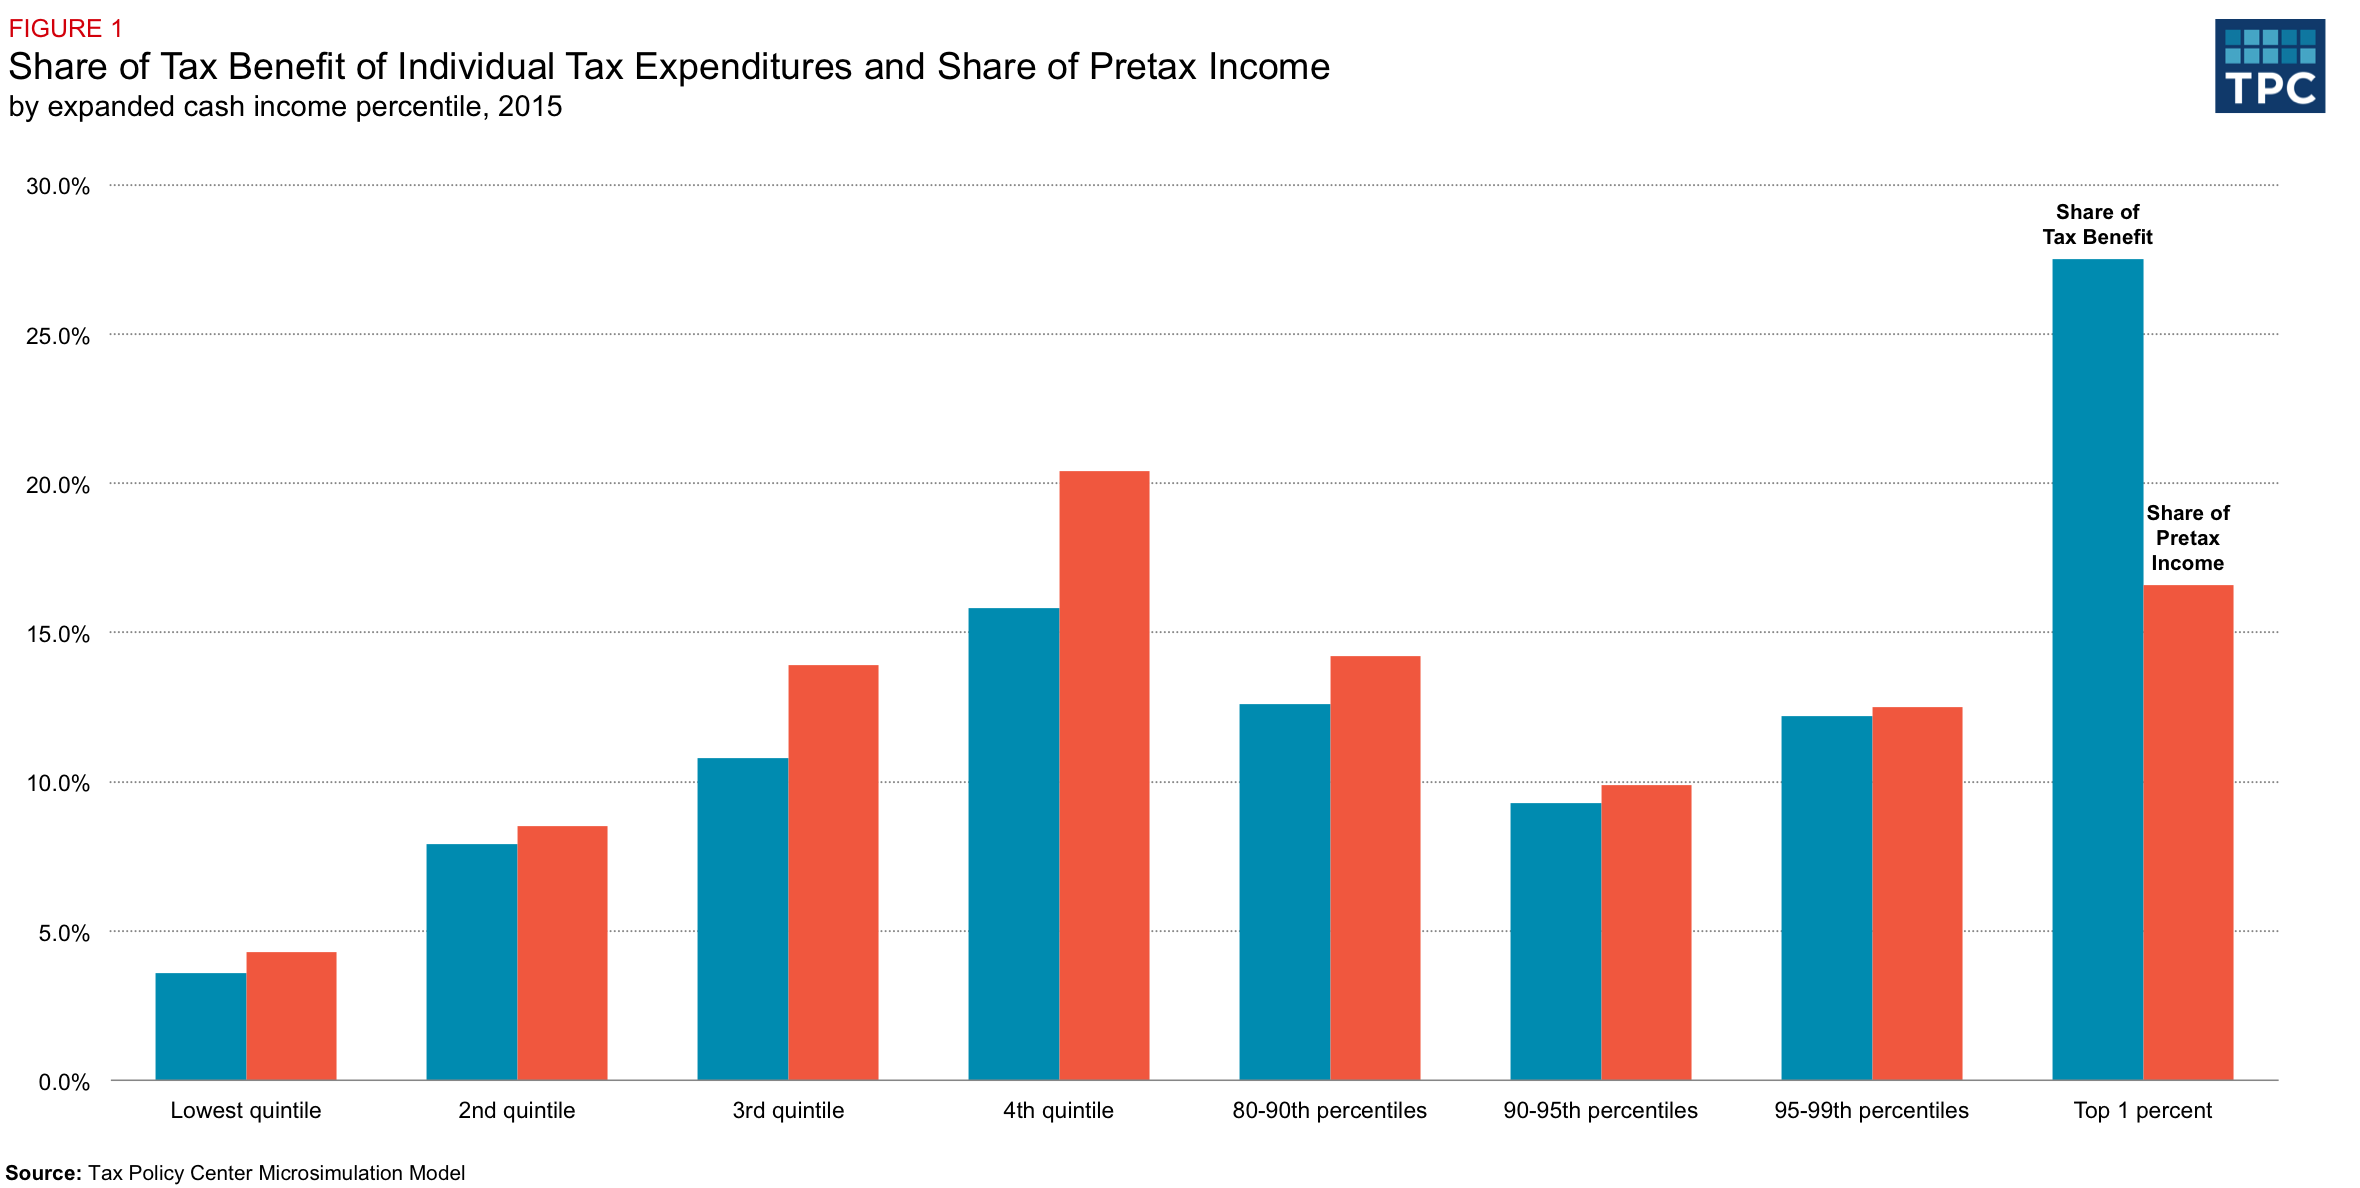
When it comes to individual tax breaks, TPC found that the highest income households receive a disproportionate share of the benefits. The highest-income 1 percent of households receive about 17 percent of all pre-tax income, but enjoy more than 27 percent of the benefits of tax expenditures. In contrast, the lowest-income 20 percent of households receive about 4 percent of the benefits, roughly the same as their share of pretax income. Taxpayers in middle and upper-middle income groups also receive roughly the same amount of or fewer benefits than their shares of pretax income (figure 1).
Different types of tax expenditures provide relatively larger benefits to different income groups. (figure 2).
The top 1 percent receives over 62 percent of the benefits from preferential rates on capital gains and dividends, the stepped up basis for inherited assets, and the exemption of most gains from the sale of personal residences. Capital gains and dividends are the main reason why the top 1 percent benefit disproportionately from tax preferences.
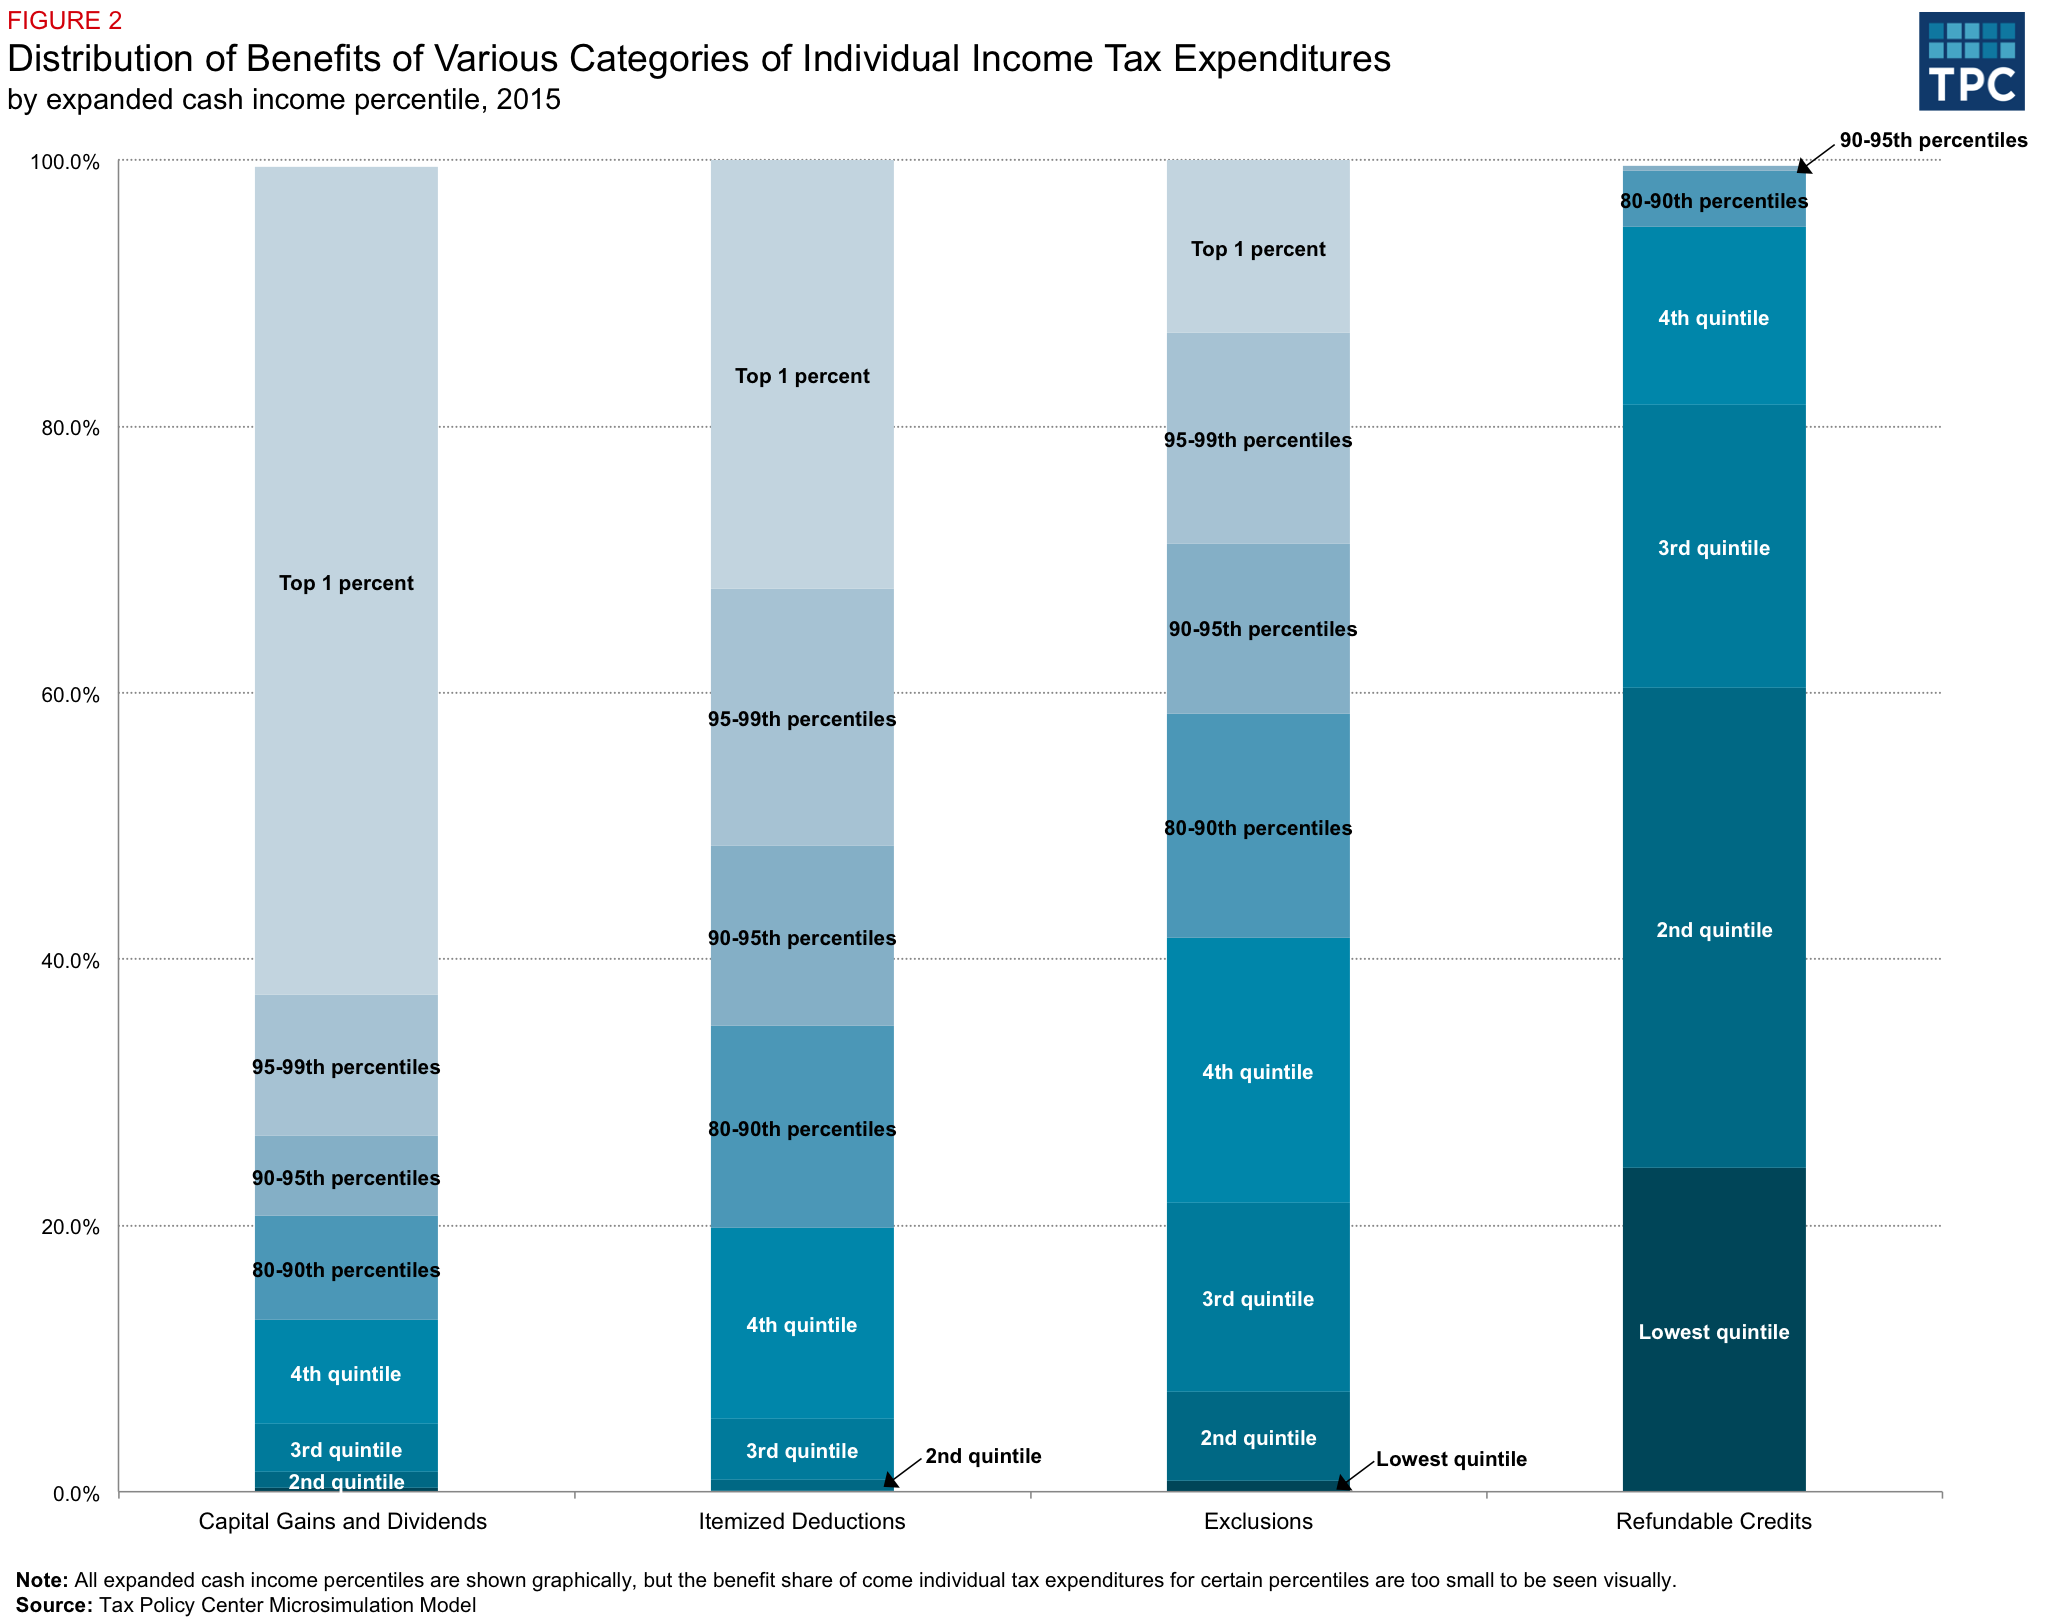
Itemized deductions, while less dramatically skewed than capital gains and dividends, also disproportionately benefit the top 1 percent. They receive about 32 percent of the benefits, while those in the bottom three quintiles together only receive about 6 percent. Meanwhile, taxpayers in the lowest quintile receive almost no benefits from preferences for capital gains and dividends and itemized deductions.
Benefits from exclusions, which include employer-sponsored health insurance, are more evenly spread out among high- and middle-income groups. The top 1 percent receive 13 percent of the benefits, about the same as those in the fourth and third quintiles. However, taxpayers in the bottom two quintiles see smaller benefits. Those in the second quintile receive about 7 percent and those in the lowest quinitile receive not even 1 percent of the benefits from exclusions.
The lowest-income households do benefit from refundable credits that mostly target low and middle-income households. The lowest-income 40 percent of households receive about 60 percent of the benefits of refundable credits, such as the earned income tax credit (EITC) and the child tax credit (CTC), including its non-refundable portion. Refundable credits, however, account for only about 0.9 percent of total pretax income while tax savings from preferences for capital gains and dividends and itemized deductions together account for about 3 percent of income.
Nearly all of us benefit to some degree from these individual tax breaks, but the highest income households benefit the most.
Rep. Ted Deutch, D-Fla., talks on his phone as he and other members of the House of Representatives leave the Capitol after passing a year-end $1 trillion spending bill on a 296-121 vote, sending the bill to the Senate in Washington, Friday, Dec. 16, 2011. (AP Photo/J. Scott Applewhite)