The voices of Tax Policy Center's researchers and staff
When it comes to property taxes, location matters. In a new TPC report, my colleague Brian David Moore and I look at just how much property taxes vary across states and counties.
Using self-reported American Community Survey data, we find that residential property taxes tend to be close to $1,000 per year, with a small share of households paying substantially more, especially in Connecticut, New Jersey, New York and New Hampshire. In recent years, 48 percent of homeowners paid between $750 and $1,750 in property taxes. About one-third—31 percent—paid less than $750 and 21 percent paid more than $1,750. Just 3 percent paid more than $4,000, with a miniscule share of homeowners (0.2 percent) paying more than $8,000.
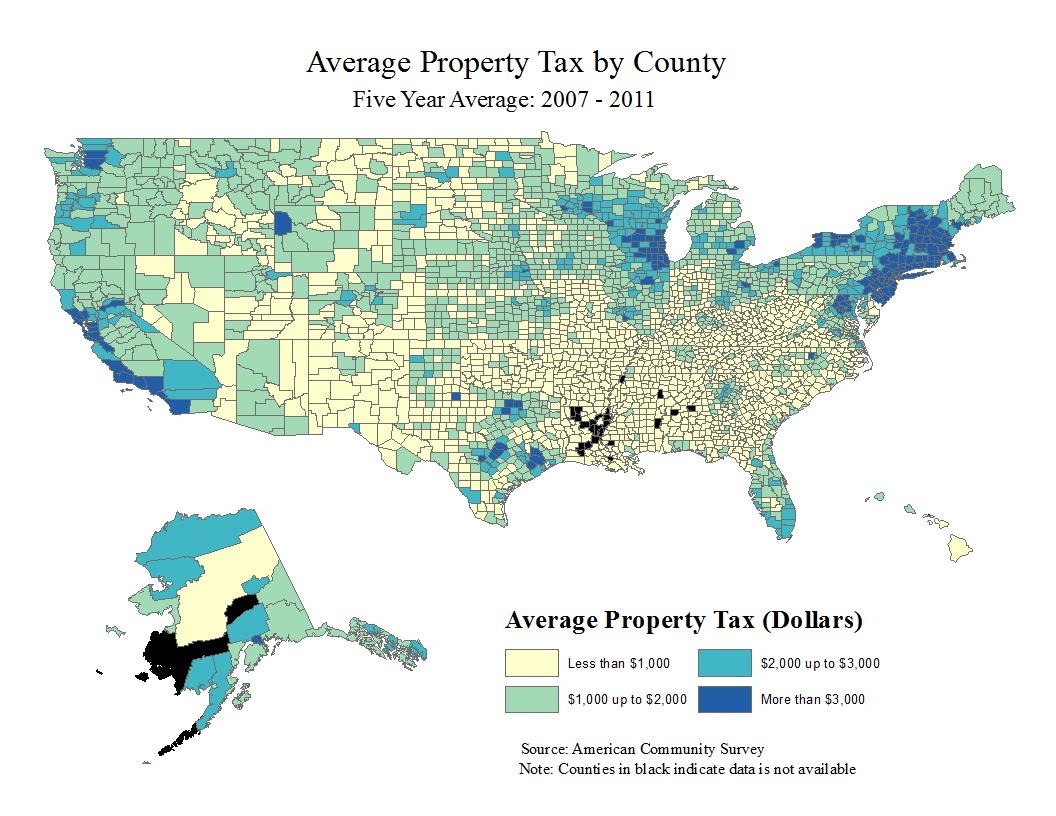
These tax burdens vary by state and county. As shown below, seven states—Connecticut, Illinois, Massachusetts, New Hampshire, New Jersey, New York, and Rhode Island—had per household property tax collections in excess of $3,500. Five states—Alabama, Arkansas, Louisiana, Mississippi, and West Virginia—had per household property taxes of $750 or less. In dollar terms, property taxes tend to be highest in counties in the northeast and the west.
 Click to Enlarge
The counties with the highest property taxes paid per homeowner are those surrounding New York City. Westchester, Nassau, and Bergen counties had the three highest average tax burdens, all in excess of $8,500; this in part reflects higher house prices and higher reliance on property taxes to provide state and local services. In general, the counties with the highest property tax burdens tend to be in New York and New Jersey, with all but three of the top 25 counties being from these two states.
Some of these differences are related to house prices, as rising housing values can increase property tax burdens. As a share of housing price, property tax burdens tend to be less than 1 percent—60 percent of homeowners fall into this group. An additional 37 percent of homeowners had property tax bills between 1 percent and 2 percent of their home’s value, and just 3 percent had property tax bills in excess of 2 percent.
Residents in all but fifteen states pay between 0.5 percent and 1.5 percent in taxes. Residents in four states pay less, while residents in 11 states pay more. The states with the highest average property tax burden as a share of housing price are New Jersey (2.0 percent), Texas (1.9 percent), and New Hampshire (1.9 percent).
Moving forward, the Tax Policy Center will regularly update these calculations as additional data become available.