Based on recommendations by the nation’s governors, the Treasury Department and IRS have designated Opportunity Zones where corporations and individuals with capital gains will receive new tax incentives to invest in low-income and undercapitalized communities. A new Urban Institute study finds that the designated zones have lower incomes, higher poverty rates, and higher unemployment rates than eligible nondesignated tracts. However, analysis shows minimal targeting of the program toward disinvested communities by a measure of investment flows developed by the researchers. You can read our brief here.
To determine whether the Opportunity Zones are well-targeted, we ranked them according to several metrics. The first, which looked at investment flows, scored tracts based on lending for commercial projects, multifamily housing, and single-family homes. We also looked at socio economic indicators such as incomes, poverty, unemployment, education and race. Finally, we looked to see if designated communities are already beginning to show signs of gentrification.
We ranked investment on a 1 to 10 scale, standardized across eligible tracts state-by-state, with 10 being the highest score. Just under a third of Opportunity Zones are located in tracts that have the lowest levels of investment while 28 percent are located in tracts attracting the highest levels of investment. This pattern is roughly similar to nondesignated tracts, with only very slight targeting towards lower-investment areas.
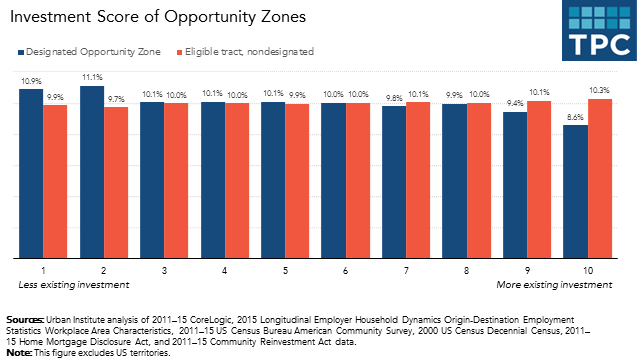
The average investment score for all designated Opportunity Zones in the US was 5.3 (compared to an average score of 5.5 for the non-designated areas). States made very different choices. States such as Montana (4.1), DC (4.4), Alaska (4.6), and Georgia (4.7) chose areas with the lowest levels of preexisting investment. By contrast, Hawaii (6.4). Vermont and Nebraska (6.6) and West Virginia (6.8) chose areas with higher level of prior investment for their Opportunity Zones.
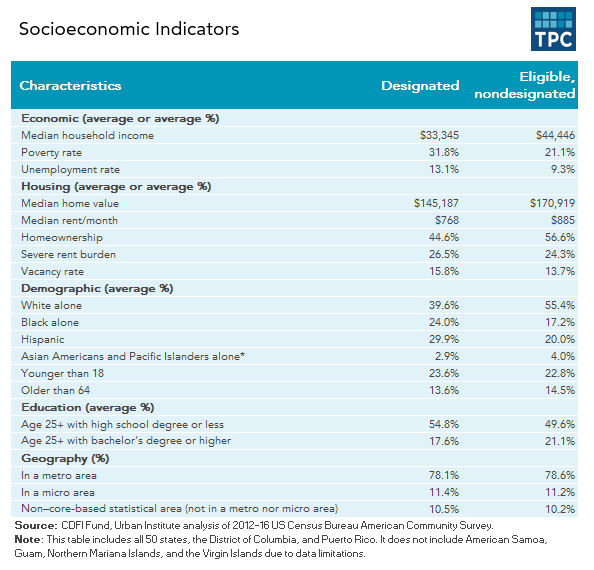
The zones seem better targeted when measured by socioeconomic standards. Designated tracks have lower incomes, higher poverty rates, and higher unemployment rates than eligible nondesignated tracts. Home values, rents, and homeownership rates also are lower. The designated tracts are less white and more Hispanic and Black. Ages are similar while education levels are somewhat lower in designated tracts. The mix of urban and rural Opportunity Zones closely tracks overall community patterns.
Finally, we looked how designated tracts changed from 2000 to 2016. This is important because where communities are already experiencing high levels of socioeconomic change, further investment risks displacing low- and moderate-income residents. Thus, Opportunity Zones in these areas may be less likely to benefit needy residents. We defined this measure by tracking changes in the share of residents with a bachelor’s degree or higher, median family income, share of non-Hispanic white residents, and average housing costs as a share of income.
We found that tracts experiencing socioeconomic change were more represented among designated tracts (3.2 percent) than among eligible nondesignated tracts (2.4 percent).
You can see distributions of selected communities for each of the 50 states, Washington, DC, and Puerto Rico online here.
Opportunity Zones were created to spur capital flow to target neighborhoods. The federal government will need to track the capital flows spurred by this new tax incentive to properly monitor and assess the program. In addition, other indicators in the selected communities—for example, a bolstered tax base, increased local earnings, or limited displacement—will eventually provide evidence on whether and how this incentive was able to drive meaningful, positive change in neighborhoods that need it.
Correction: Because of a coding error in the “Socioeconomic Indicators” table, the shares of people age 25+ with a bachelor’s degree or higher were incorrect in an earlier version of this blog post (corrected 7/12/18).
