From
2016
To
2016
PDF
File
(2.69 MB)
Excel
File
(191.5 KB)
Display Date
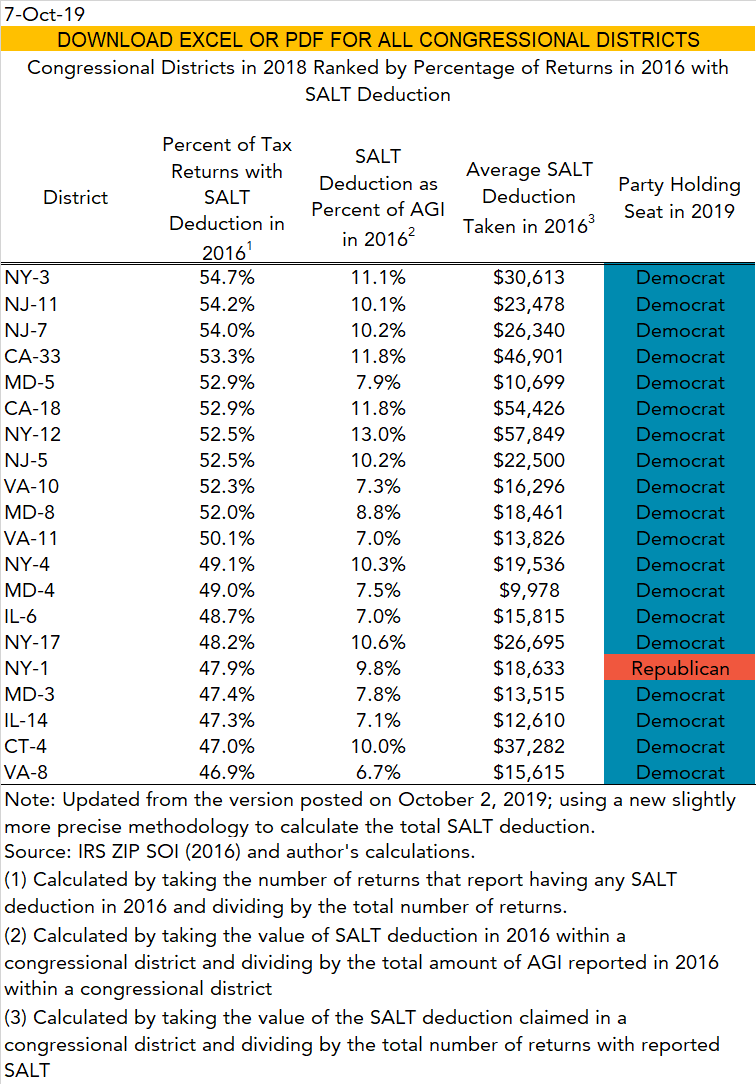
Workbook includes three tables. The first table ranks congressional districts by the percent of returns with a state and local tax deduction in 2016. The second table ranks congressional districts by the percentage of returns with a state and local tax deduction in 2014. The third ranks congressional districts by the state and local tax deduction as a percentage of AGI in 2014.
