Brief
April 7, 2016
This brief examines proposals that would change the calculation of Pell grants—the major program the federal government has to make higher education affordable to low-income students—suggesting a new approach that would be reliant on only two family characteristics and would be easier for families to understand. It follows earlier work in Simplifying Federal Student Aid: How Do the Plans Stack Up?, in which we analyze how eight different proposals to simplify the way we determine Pell grant eligibility would affect different types of students (Rueben, Gault, and Baum 2015).
Under the current system, after students answer the 105-question FAFSA form, their Pell grants are calculated based on their expected family contributions (EFCs)—estimates of what families can afford to pay—which are then subtracted from the maximum grant amount. In our earlier work, three of the eight proposals simplify the Pell application process through changes to the EFC calculation. The remaining five proposals move away from the current system of allocating aid, determining awards based on some combination of income, family composition and size, and number of family members attending college (Rueben, Gault, and Baum 2015). Some use formulas and others use look-up tables, with students receiving a certain Pell award if their family income falls within a certain range.1 All have winners and losers compared with the current system, but each would make knowing how large a Pell grant would be awarded much more straightforward. It is clear from these proposals that the details matter.
One of these proposals uses a two-factor formula based only on income and family size. This model ties Pell amounts to how family income compares with the federal poverty level (FPL), which varies by family size. Under this formula, families with incomes at or below 150 percent of the FPL would receive maximum Pell awards; award amounts would phase down evenly from maximum Pell to zero for those with incomes between 150 and 250 percent of the FPL. We conclude that splitting out the Pell grant calculation from the rest of the federal aid application process using a formula like the two-factor model, while maintaining a simplified EFC calculation for other types of aid, is optimal. Under such a federal aid system, the Pell calculation would be transparent for students and their families, who could then predict their Pell awards far in advance of college enrollment. The formula would be easily adjustable to meet Pell cost targets, accommodating more or fewer students as funding levels and application numbers change. Separating out Pell grants means not having to modify the EFC formula to control Pell program expenditures, protecting that formula for other aid.
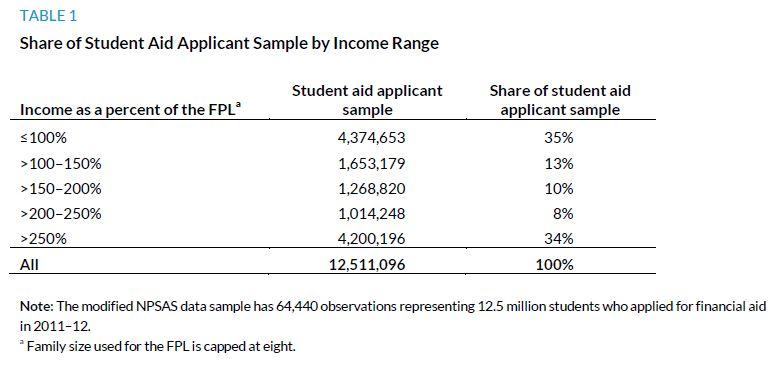
A proposal similar to what we consider under the two-factor model is the Financial Aid Simplification and Transparency (FAST) Act, first proposed in 2014 and reintroduced in 2015 by Senators Lamar Alexander (R-TN) and Michael Bennet (D-CO) and several cosponsors.2 The FAST Act bill includes look-up tables by family size that phase down awards depending on income as a percent of the FPL. Maximum Pell awards would go to families with income up to 100 percent of the FPL and awards would go to zero at 250 percent of the FPL.3 Though the awards under the FAST Act look-up tables would decrease as income increases, they would not do so in a uniform way.4 Implementing a model based on the FAST Act look-up tables that uses a formula for a smooth phase down of award amounts would make award dollars less arbitrary. This formula would look similar to that of the two-factor model we examine in the report (Rueben, Gault, and Baum 2015), but it would begin the phase down of awards at a lower income threshold (100 rather than 150 percent of the FPL), limiting the number of students receiving the maximum Pell award. The FAST Act proposal caps family size at eight people, rather than six as under our original two-factor model, so awards go further up the income ladder for larger families. Table 1 provides a breakdown of our sample of financial aid applicants by income range relative to the FPL to show what share of students would be affected by these formulas.
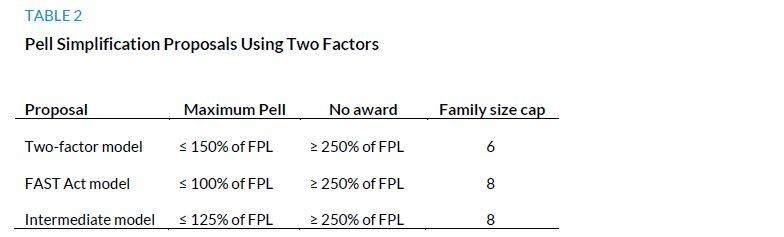
In this brief, we take a further look into the possibility of awarding Pell grants using just two characteristics (income and family size) and then include family composition to examine some equity concerns that the original simplified formulas raise. We compare the two-factor model with the model adapted from the FAST Act legislation to look at the effect of modifying the income threshold for maximum Pell grants (table 2). We also consider an intermediate proposal with a phasedown of awards beginning at an income level of 125 percent of the FPL—midway between these two proposals—and with the same family size cap of eight as under the FAST Act model. Not surprisingly, the differences affect the size of Pell grants awarded; our two-factor model awards larger grants for most students in families between 100 and 250 percent of the FPL than would be awarded under the FAST Act model because of the later onset of the phasedown from maximum Pell awards, but the FAST Act model gives larger awards to some students in families of seven or more.
There will always be tradeoffs between a simpler formula and more precise targeting. A model that uses just income and family size does not take wealth into account; thus Pell awards for families with significant assets but low incomes may be higher than in a model like the current system that accounts for wealth. The current Pell formula takes family composition and family size into account, with separate calculations for students who are dependent children, independents students with children, and independent students without children. In the simplified models using two factors, because the poverty levels used to determine awards are based on family size but not composition, students in small families of two or three members with a parent and child get smaller Pell grants than under our current system. This raises the question of fairness in terms of family structure: despite all having family sizes of two, should a single parent with a child in college or a college student with a child be treated the same as a married student without any dependents? This brief will also consider the effect of treating small families with children more generously (detailed further below) as an option to address equity concerns under these proposals.
For the estimates in this brief, we use the same modified 2011–12 National Postsecondary Student Aid Study (NPSAS) sample of undergraduate students who applied for financial aid as in our report.5 We estimate their actual Pell awards using information in the data and compare these baseline estimates to our estimates of awards under each proposal.6 We use the same sample of students for each proposal and assume a maximum grant of $5,550 (the maximum Pell grant award for the 2011–12 school year) for full-time students for all proposals. We also apply the same rules about minimum grant size and how grants vary with enrollment intensity.7 In addition, all three proposals, as modeled, remove the cost-of attendance adjustment from the calculation of Pell awards.8 In all estimates, we use information on applications from the 2011–12 academic year and income information from 2010.
To examine if there is a simple way to be more generous to small families with dependent children, we look at how our estimates will change if we use a more generous income measure to provide extra support to students in these families (table 3). The small-family alternative formulas would cover families of two or three people in which the student has a dependent child as well as those in which the student is a dependent. We allow for more generous awards for these families by using the FPL for a family size of four rather than for the actual family size (of two or three) in their Pell formula. Thus, a two-person family with a single parent and a dependent child in school would be eligible for a maximum Pell award in 2011–12 based on a FPL of $22,050 rather than $14,570.
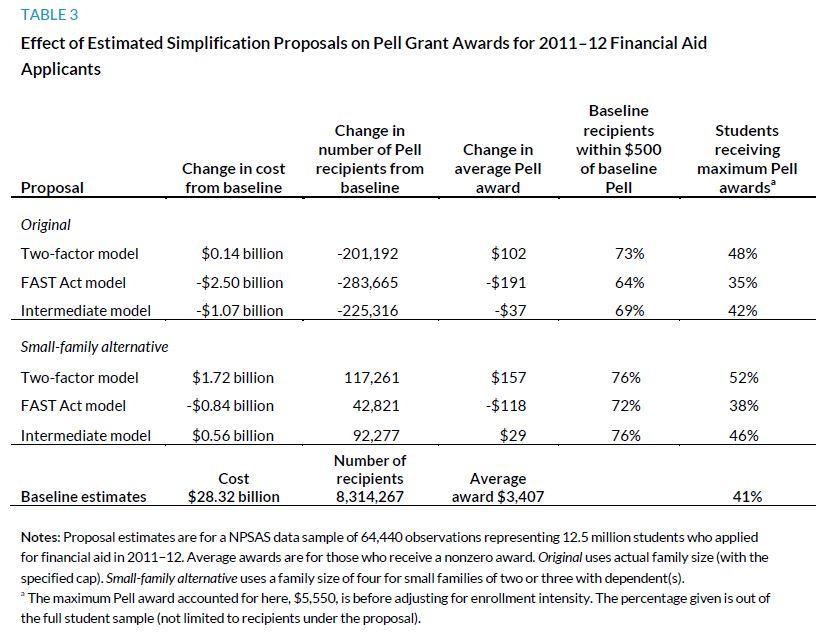
The proposals are all close to cost neutral relative to actual 2011–12 Pell costs, ranging from a savings of almost 9 percent (under the FAST Act model) to an additional cost of less than 1 percent (under the two-factor model, which provides the maximum Pell grant up to 150 percent of the FPL). Switching from the original to the small-family model would serve more students and increase average awards, leading to some cost increases for each plan. Even so, the alternative FAST Act model would remain less expensive than the current Pell program (saving 3 percent), and the increased cost under the alternative two-factor model, the most generous of the three proposals, would only be about 6 percent.
Families of two or three with dependents in which the student is a parent or a child represent 35 percent of the student sample and 40 percent of actual Pell recipients. These families represent a disproportionate share of baseline recipients who are worse off under the proposals using two factors. Small families with dependents account for 55 percent of baseline recipients who receive smaller awards under the two-factor model (and 52 percent under the FAST Act model). Providing more support to these families by switching to the small-family alternative formula means they represent a lower portion of baseline recipients who receive smaller awards under the proposals—just 20 percent under the two-factor model and 32 percent under the FAST Act model.
There are ways to simplify how we award Pell grants that will maintain equity across groups and make the aid transparent and predictable in advance of college enrollment. This brief illustrates how three policy details would affect the distribution of Pell grants and the cost to the federal government. Having an automatic maximum Pell award up to 150 percent of the FPL under the two-factor model formula would mean 74 percent of Pell recipients would be eligible for a maximum Pell grant (before adjusting for enrollment intensity).9 In contrast, if the size of Pell awards began falling after 100 percent of the FPL as under the FAST Act model formula, only 54 percent of proposal recipients would be eligible for a maximum award. The higher cap of eight on family size under the FAST Act model would provide more support to families of seven or more, although these large families account for just 2.5 percent of our student sample.
Finally, our solution of using an alternate higher poverty level for small multigeneration families is a simple modification that recognizes that there is a difference between a married student without any dependents and a family with a parent and child, one of whom is in college. Any of these formulas could be programmed into an app for a smartphone or tablet, with the student needing to answer three questions:
We are excited by the attention that simplification of the financial aid process is receiving. This brief is meant to illustrate how details matter. Simplification is important, and we hope this analysis aids in designing better legislation and understanding different tradeoffs when considering reform. Appendix A provides more detailed information about the distributional effects of changing Pell grant calculations under the six options outlined.
Description
Our two-factor model uses the 2010 FPL guidelines by family size to calculate Pell amounts, with family size capped at six people.10 Applicants (parents for dependent students and students and/or spouses for independent students) with an adjusted gross income (AGI) equal to or below 150 percent of the FPL for their family size would receive the maximum Pell grant of $5,550 in 2011–12. The award amount would phase out evenly between 150 and 250 percent of the FPL, where Pell grants would go to zero.
This proposal is easily translated into look-up tables that display Pell awards by income levels and family size, but the actual calculation would use a formula for awards between 150 and 250 percent of the FPL:

Estimates
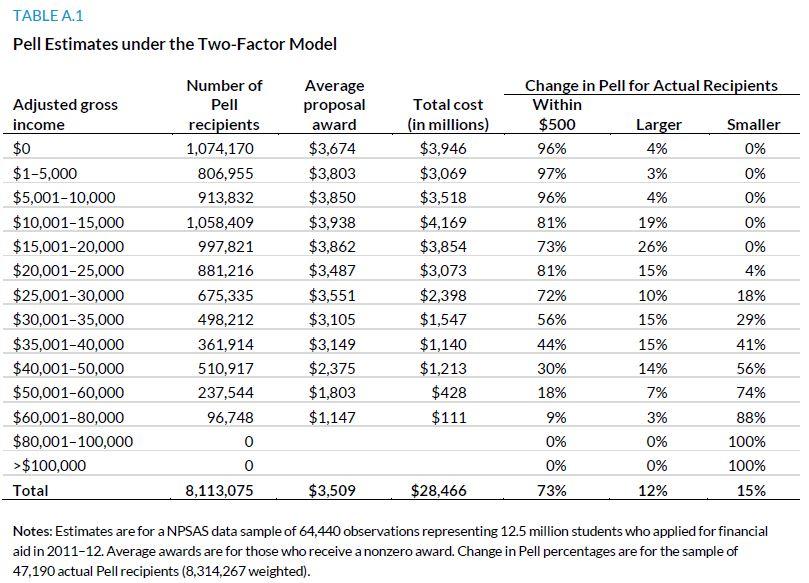
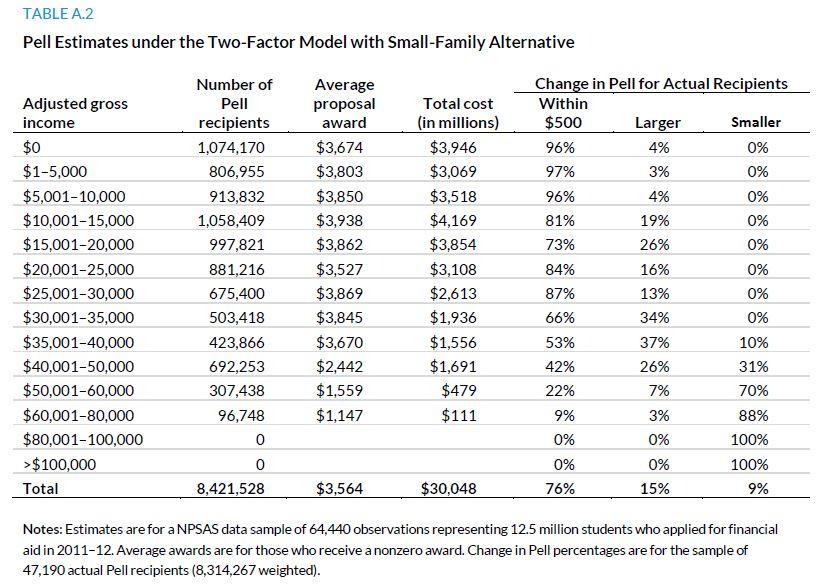
Under our two-factor model, award amounts average $102 more than the baseline, but, as 201,192 fewer students are served, the proposal is nearly cost neutral. The decrease in recipients is driven by a decrease in the number of awards to students with AGI above $60,000, as the number of recipients with parent (dependent) or student (independent) AGIs at or below $35,000 actually increases. Recipients with incomes above $80,000 are totally eliminated under this proposal. Adjusting the formula to better accommodate small families with dependent children would increase average awards even further and actually adds 117,261 recipients compared with the baseline, resulting in an added cost of $1.72 billion.
Much of the cost increase comes from increased average award amounts to lower-income students, offsetting the decreased costs from fewer awards and lower average grants in the higher AGI brackets (table A.1). Under the original two-factor model, comparing who gains and who loses from our baseline estimates, 73 percent of baseline Pell recipients are within $500 of their baseline award, 12 percent receive larger awards, and 15 percent receive smaller awards. Recipients with incomes of $35,000 or less have the same or larger awards 95 percent of the time. Most students whose Pell grants decline have higher incomes; only 5 percent of all baseline recipients no longer receive an award under the proposal, but the majority of baseline recipients in the higher-income groups lose Pell grants. These patterns in part reflect the elimination of the adjustment for number of students in the family in college and the use of the FPL for a family of six to determine income limits for families with seven or more members.11 Moving to the small-family alternative for the two-factor model, families fare even better, particularly those in the mid-income range of $20,000 to $50,000 (table A.2). Seventy-six percent of baseline recipients receive awards within $500 of their baseline amount and another 15 percent receive larger awards.
Description
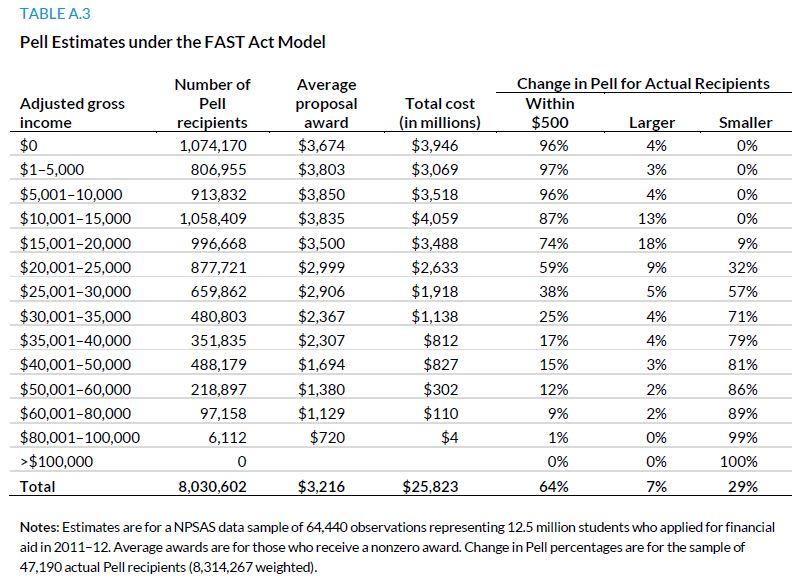
This proposal reflects our implementation of a formula based on the FAST Act look-up tables (rather than the FAST Act look-up tables themselves). Like the two-factor proposal, the FAST Act model formula uses 2010 FPL guidelines by family size to calculate award amounts for Pell grants. The family size cap is higher than the two-factor proposal at eight people. Families with AGI of 100 percent of the FPL or less (according to their family size) receive the maximum 2011–12 Pell award of $5,550. Award levels phase down between 100 and 250 percent of the FPL, and families with income of 250 percent of the FPL or more are not eligible for Pell.12
The FAST Act model would use a formula to determine awards between 100 and 250 percent of the FPL:

Estimates
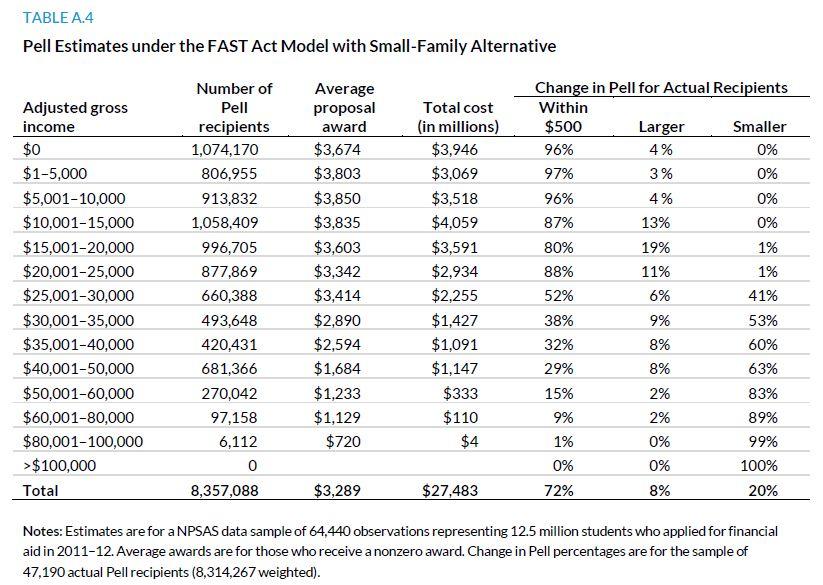
Relative to the baseline, the number of recipients under the FAST Act model decreases by 283,665; with average awards decreasing by close to $200, the cost decrease under the FAST Act is $2.50 billion. However, average awards increase for low-income families with AGIs at or below $20,000. Adding support for small families with children increases average awards relative to the original FAST Act model, closing the gap to $118 below average baseline awards. Although award dollars under the alternative FAST Act model are less generous than current awards, there are 42,821 more recipients than under the baseline, with the most notable increase in recipients for families with AGIs in the $20,000 to $50,000 range.
Sixty-four percent of baseline recipients receive FAST Act model Pell awards within $500 of baseline awards, 7 percent receive larger awards, and 29 percent receive smaller awards (table A.3). More baseline recipients start to lose award dollars under the FAST Act model as we move up the income ladder, with a majority receiving smaller awards starting at incomes of $25,000. The small-family alternative formula increases those within $500 of their baseline award to 72 percent and decreases those with smaller awards to 20 percent (table A.4). Even so, beginning at $30,000, a majority of baseline recipients receive smaller awards.
Description
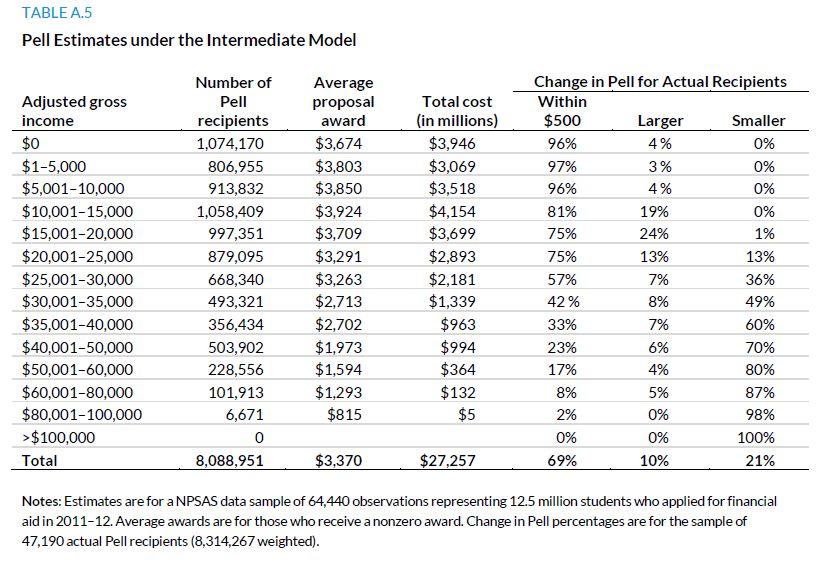
As an option midway between the two-factor model and the FAST Act model, the intermediate model likewise bases Pell awards on income as a percent of the 2010 FPL guidelines by family size. Family size is capped at eight people, as with the FAST Act model. Families with income at or below 125 percent of the FPL are eligible for Pell awards of $5,550, the maximum award level in 2011–12. Between 125 and 250 percent of the FPL, Pell awards phase down uniformly before going to zero at 250 percent of the FPL.
The intermediate model formula for families with income between 125 and 250 percent of the FPL would be as follows:

Estimates
At $3,370, overall average Pell awards under the intermediate model are close to that of the baseline ($3,407). Total cost under the original intermediate model formula is about $1 billion less than under the baseline because there would be 225,316 fewer recipients. Switching to the small-family alternative boosts the average award to slightly above the baseline amount (by $29) and the number of recipients exceeds those under the baseline by 92,277. Relative to the baseline, the small-family alternative for the intermediate model adds $0.56 billion in cost.
Sixty-nine percent of baseline recipients receive awards within $500 of their baseline amount using the intermediate model; 10 percent receive larger awards, and another 21 percent receive smaller awards (table A.5). Adjusting for small families with dependents improves the comparison for baseline recipients to 76 percent receiving awards within $500, 12 percent with larger awards, and 13 percent with smaller awards (table A.6). Those losing out under the intermediate model are more concentrated further up the income distribution. Under the intermediate model, the number of recipients starts decreasing relative to the baseline for AGI groups of above $35,000, resulting in smaller awards for a majority of baseline recipients above this income level. The incorporation of the small-family alternative into the proposal pushes this up further to see fewer recipient families than under the baseline beginning at income groups of above $50,000.

Dynarski, Susan, Judith Scott-Clayton, and Mark Wiederspan. 2013. “Simplifying Tax Incentives and Aid for College: Progress and Prospects.” NBER Working Paper No. 18707. Cambridge, MA: National Bureau of Economic Research.
Rueben, Kim, Sarah Gault, and Sandy Baum. 2015. Simplifying Federal Student Aid: How Do the Plans Stack Up? Washington, DC: Urban Institute.
Kim Rueben, a senior fellow in the Urban-Brookings Tax Policy Center at the Urban Institute, is an expert on state and local public finance and the economics of education. Her research examines state and local tax policy, fiscal institutions, state and local budgets, issues of education finance, and public-sector labor markets. Rueben directs the State and Local Finance Initiative. Her current projects include work on state budget shortfalls, financing options for California, the fiscal health of cities, and examining higher education tax credits and grants. She served on the DC Tax Revision Commission in 2013 and is currently serving on a National Academy of Sciences panel on the economic and fiscal consequences of immigration. In addition to her position at Urban, Rueben is an adjunct fellow at the Public Policy Institute of California.
Sarah Gault is a research assistant in the Urban-Brookings Tax Policy Center at the Urban Institute.
Sandy Baum is a senior fellow in the Income and Benefits Policy Center at the Urban Institute, a research professor at the George Washington University Graduate School of Education and Human Development, and Professor Emerita of Economics at Skidmore College. She has written and spoken extensively on college access, college pricing, student aid policy, student debt, affordability, and other aspects of higher education finance.
This brief was funded by the Bill & Melinda Gates Foundation. We are grateful to them and to all our funders, who make it possible for Urban to advance its mission.
The views expressed are those of the authors and should not be attributed to the Urban Institute, its trustees, or its funders. Funders do not determine research findings or the insights and recommendations of Urban experts. Further information on the Urban Institute’s funding principles is available at www.urban.org/support.
We especially thank Mark Wiederspan and Sue Dynarski for sharing their programs in modeling EFC simplification and Elizabeth Forney for her help in editing this report. We also thank Greg Acs and Martha Johnson for comments on earlier drafts, and Jeff Appel, Lauren Davies, Joseph Mais, Robert Moran, Spiros Protopsaltis, and Kathleen Smith for helpful comments on our original report.